FIO 工具用来测试硬盘的IO性能,直接操作存储设备,当然,在测试的时候,对会整个设备进行读写。如果不想对整盘进行操作,可以先用dd 命令,创建出一个文件,放在存储设备上,然后使用该文件进行测试。FIO 工具非常小巧,使用也很简单。
fio is an I/O tool meant to be used both for benchmark and stress/hardware verification. It has support for 19 different types of I/O engines (sync, mmap, libaio, posixaio, SG v3, splice, null, network, syslet, guasi, solarisaio, and more), I/O priorities (for newer Linux kernels), rate I/O, forked or threaded jobs, and much more. It can work on block devices as well as files. fio accepts job descriptions in a simple-to-understand text format. Several example job files are included. fio displays all sorts of I/O performance information, including complete IO latencies and percentiles. Fio is in wide use in many places, for both benchmarking, QA, and verification purposes. It supports Linux, FreeBSD, NetBSD, OpenBSD, OS X, OpenSolaris, AIX, HP-UX, Android, and Windows.
官网:http://git.kernel.dk/?p=fio.git;a=summary
一、安装FIO
yum install -y fio
二、语法说明
fio -h
fio-3.7
fio [options] [job options]
  --debug=options       Enable debug logging. May be one/more of:
                        process,file,io,mem,blktrace,verify,random,parse,
                        diskutil,job,mutex,profile,time,net,rate,compress,
                        steadystate,helperthread
  --parse-only          Parse options only, don't start any IO
  --output              Write output to file
  --bandwidth-log       Generate aggregate bandwidth logs
  --minimal             Minimal (terse) output
  --output-format=type  Output format (terse,json,json+,normal)
  --terse-version=type  Set terse version output format (default 3, or 2 or 4)
  --version             Print version info and exit
  --help                Print this page
  --cpuclock-test       Perform test/validation of CPU clock
  --crctest=[type]      Test speed of checksum functions
  --cmdhelp=cmd         Print command help, "all" for all of them
  --enghelp=engine      Print ioengine help, or list available ioengines
  --enghelp=engine,cmd  Print help for an ioengine cmd
  --showcmd             Turn a job file into command line options
  --eta=when            When ETA estimate should be printed
                        May be "always", "never" or "auto"
  --eta-newline=time    Force a new line for every 'time' period passed
  --status-interval=t   Force full status dump every 't' period passed
  --readonly            Turn on safety read-only checks, preventing writes
  --section=name        Only run specified section in job file, multiple sections can be specified
  --alloc-size=kb       Set smalloc pool to this size in kb (def 16384)
  --warnings-fatal      Fio parser warnings are fatal
  --max-jobs=nr         Maximum number of threads/processes to support
  --server=args         Start a backend fio server
  --daemonize=pidfile   Background fio server, write pid to file
  --client=hostname     Talk to remote backend(s) fio server at hostname
  --remote-config=file  Tell fio server to load this local job file
  --idle-prof=option    Report cpu idleness on a system or percpu basis
                        (option=system,percpu) or run unit work
                        calibration only (option=calibrate)
  --inflate-log=log     Inflate and output compressed log
  --trigger-file=file   Execute trigger cmd when file exists
  --trigger-timeout=t   Execute trigger at this time
  --trigger=cmd         Set this command as local trigger
  --trigger-remote=cmd  Set this command as remote trigger
  --aux-path=path       Use this path for fio state generated files

Fio was written by Jens Axboe <axboe@kernel.dk>
[root@DT_Node-172_30_105_32 ~]#
filename=/dev/sdb1 测试文件名称,通常选择需要测试的盘的data目录。
direct=1 测试过程绕过机器自带的buffer。使测试结果更真实。
rw=randwrite 测试随机写的I/O
rw=randrw 测试随机写和读的I/O
bs=16k 单次io的块文件大小为16k
bsrange=512-2048 同上,提定数据块的大小范围
size=5g 本次的测试文件大小为5g,以每次4k的io进行测试。
numjobs=30 本次的测试线程为30.
runtime=1000 测试时间为1000秒,如果不写则一直将5g文件分4k每次写完为止。
ioengine=psync io引擎使用pync方式
rwmixwrite=30 在混合读写的模式下,写占30%
group_reporting 关于显示结果的,汇总每个进程的信息。
lockmem=1g 只使用1g内存进行测试。
zero_buffers 用0初始化系统buffer。
nrfiles=8 每个进程生成文件的数量。
bw:磁盘的吞吐量,这个是顺序读写考察的重点
iops:磁盘的每秒读写次数,这个是随机读写考察的重点
参考 https://www.jianshu.com/p/94ac980ed29e
三、测试
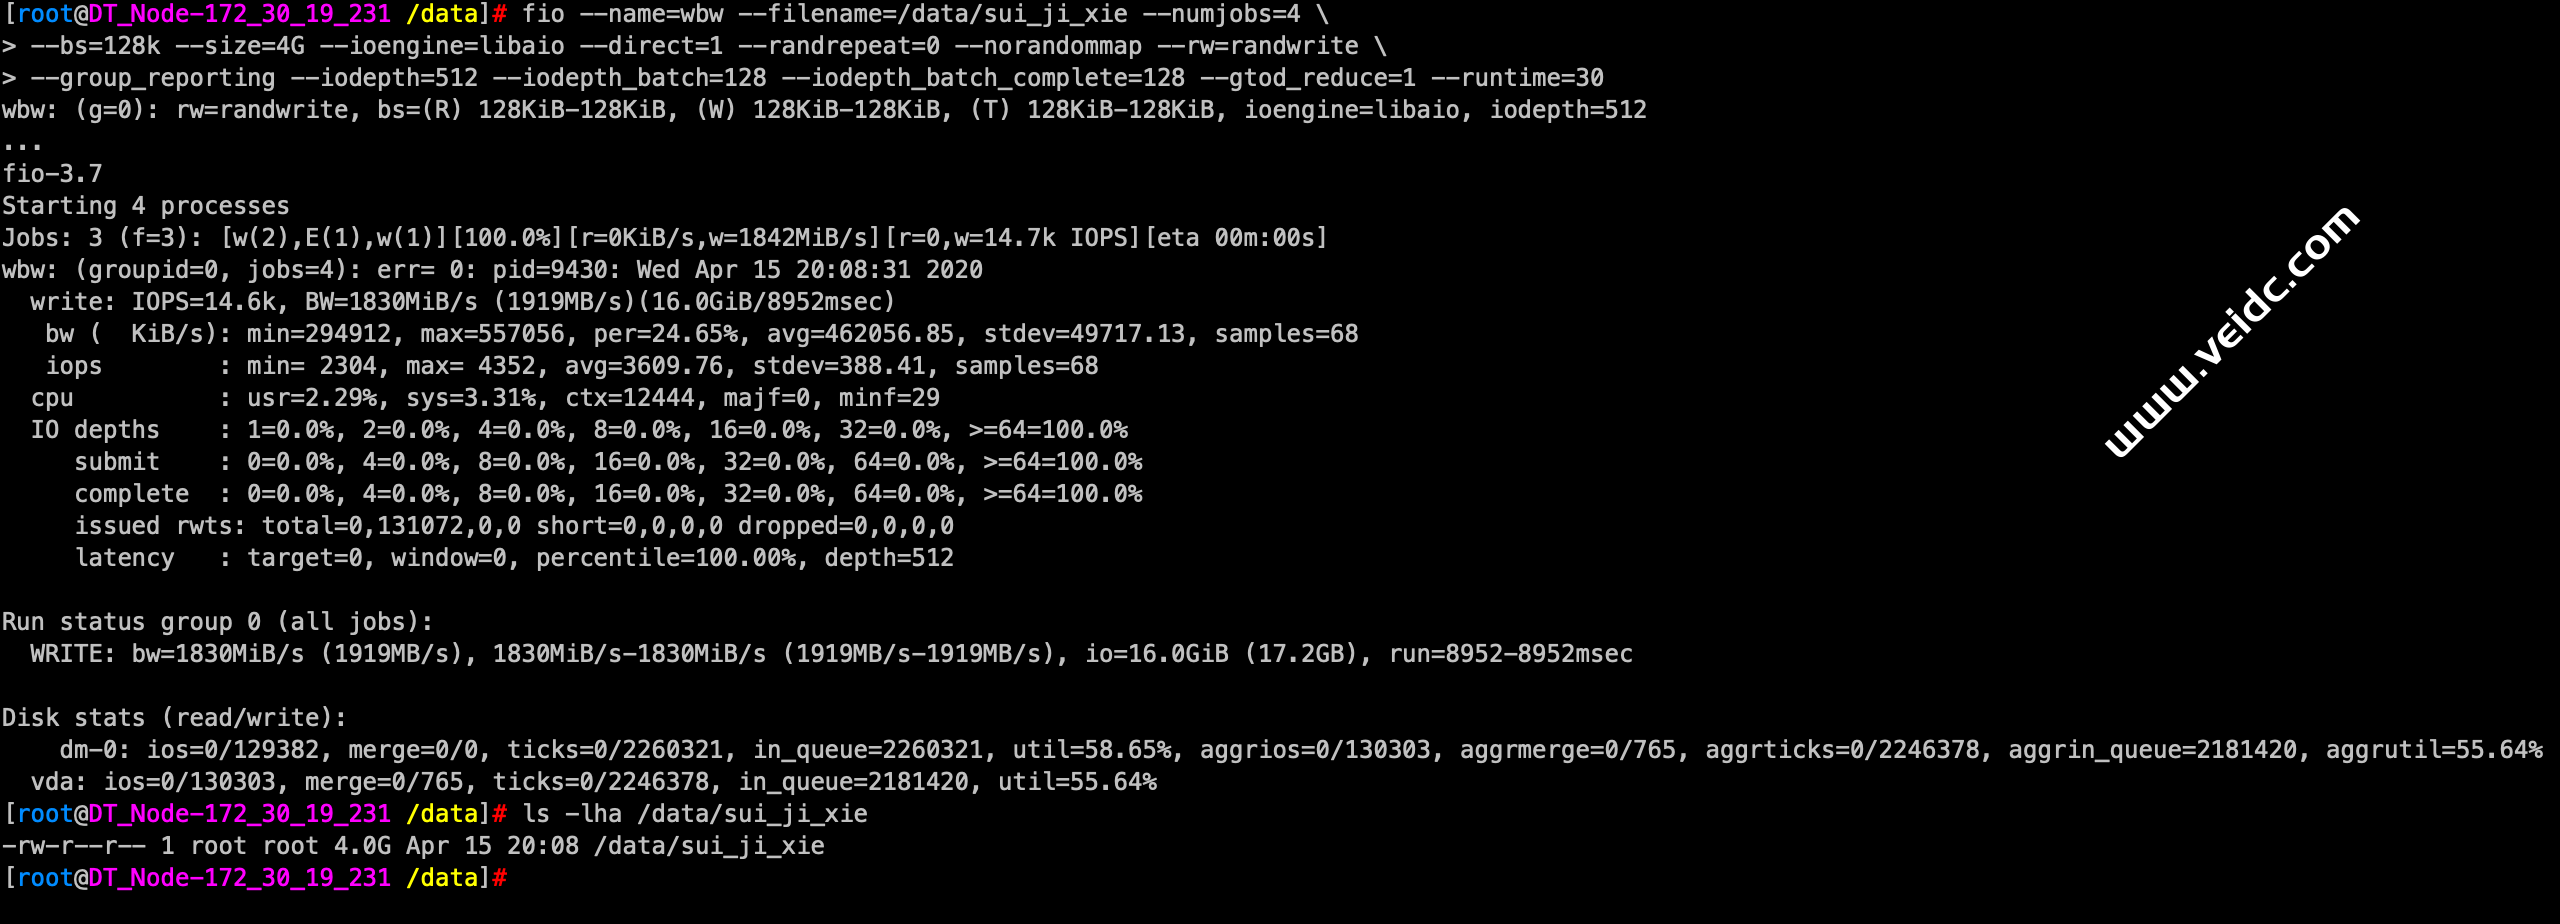
–测试随机写带宽
[root@DT_Node-172_30_19_231 /data]# fio --name=wbw --filename=/data/sui_ji_xie --numjobs=4 \
--bs=128k --size=4G --ioengine=libaio --direct=1 --randrepeat=0 --norandommap --rw=randwrite \
--group_reporting --iodepth=512 --iodepth_batch=128 --iodepth_batch_complete=128 --gtod_reduce=1 --runtime=30
wbw: (g=0): rw=randwrite, bs=(R) 128KiB-128KiB, (W) 128KiB-128KiB, (T) 128KiB-128KiB, ioengine=libaio, iodepth=512
...
fio-3.7
Starting 4 processes
Jobs: 3 (f=3): [w(2),E(1),w(1)][100.0%][r=0KiB/s,w=1842MiB/s][r=0,w=14.7k IOPS][eta 00m:00s]
wbw: (groupid=0, jobs=4): err= 0: pid=9430: Wed Apr 15 20:08:31 2020
  write: IOPS=14.6k, BW=1830MiB/s (1919MB/s)(16.0GiB/8952msec)
   bw (  KiB/s): min=294912, max=557056, per=24.65%, avg=462056.85, stdev=49717.13, samples=68
   iops        : min= 2304, max= 4352, avg=3609.76, stdev=388.41, samples=68
  cpu          : usr=2.29%, sys=3.31%, ctx=12444, majf=0, minf=29
  IO depths    : 1=0.0%, 2=0.0%, 4=0.0%, 8=0.0%, 16=0.0%, 32=0.0%, >=64=100.0%
     submit    : 0=0.0%, 4=0.0%, 8=0.0%, 16=0.0%, 32=0.0%, 64=0.0%, >=64=100.0%
     complete  : 0=0.0%, 4=0.0%, 8=0.0%, 16=0.0%, 32=0.0%, 64=0.0%, >=64=100.0%
     issued rwts: total=0,131072,0,0 short=0,0,0,0 dropped=0,0,0,0
     latency   : target=0, window=0, percentile=100.00%, depth=512

Run status group 0 (all jobs):
  WRITE: bw=1830MiB/s (1919MB/s), 1830MiB/s-1830MiB/s (1919MB/s-1919MB/s), io=16.0GiB (17.2GB), run=8952-8952msec

Disk stats (read/write):
    dm-0: ios=0/129382, merge=0/0, ticks=0/2260321, in_queue=2260321, util=58.65%, aggrios=0/130303, aggrmerge=0/765, aggrticks=0/2246378, aggrin_queue=2181420, aggrutil=55.64%
  vda: ios=0/130303, merge=0/765, ticks=0/2246378, in_queue=2181420, util=55.64%
[root@DT_Node-172_30_19_231 /data]# ls -lha /data/sui_ji_xie
-rw-r--r-- 1 root root 4.0G Apr 15 20:08 /data/sui_ji_xie
[root@DT_Node-172_30_19_231 /data]#
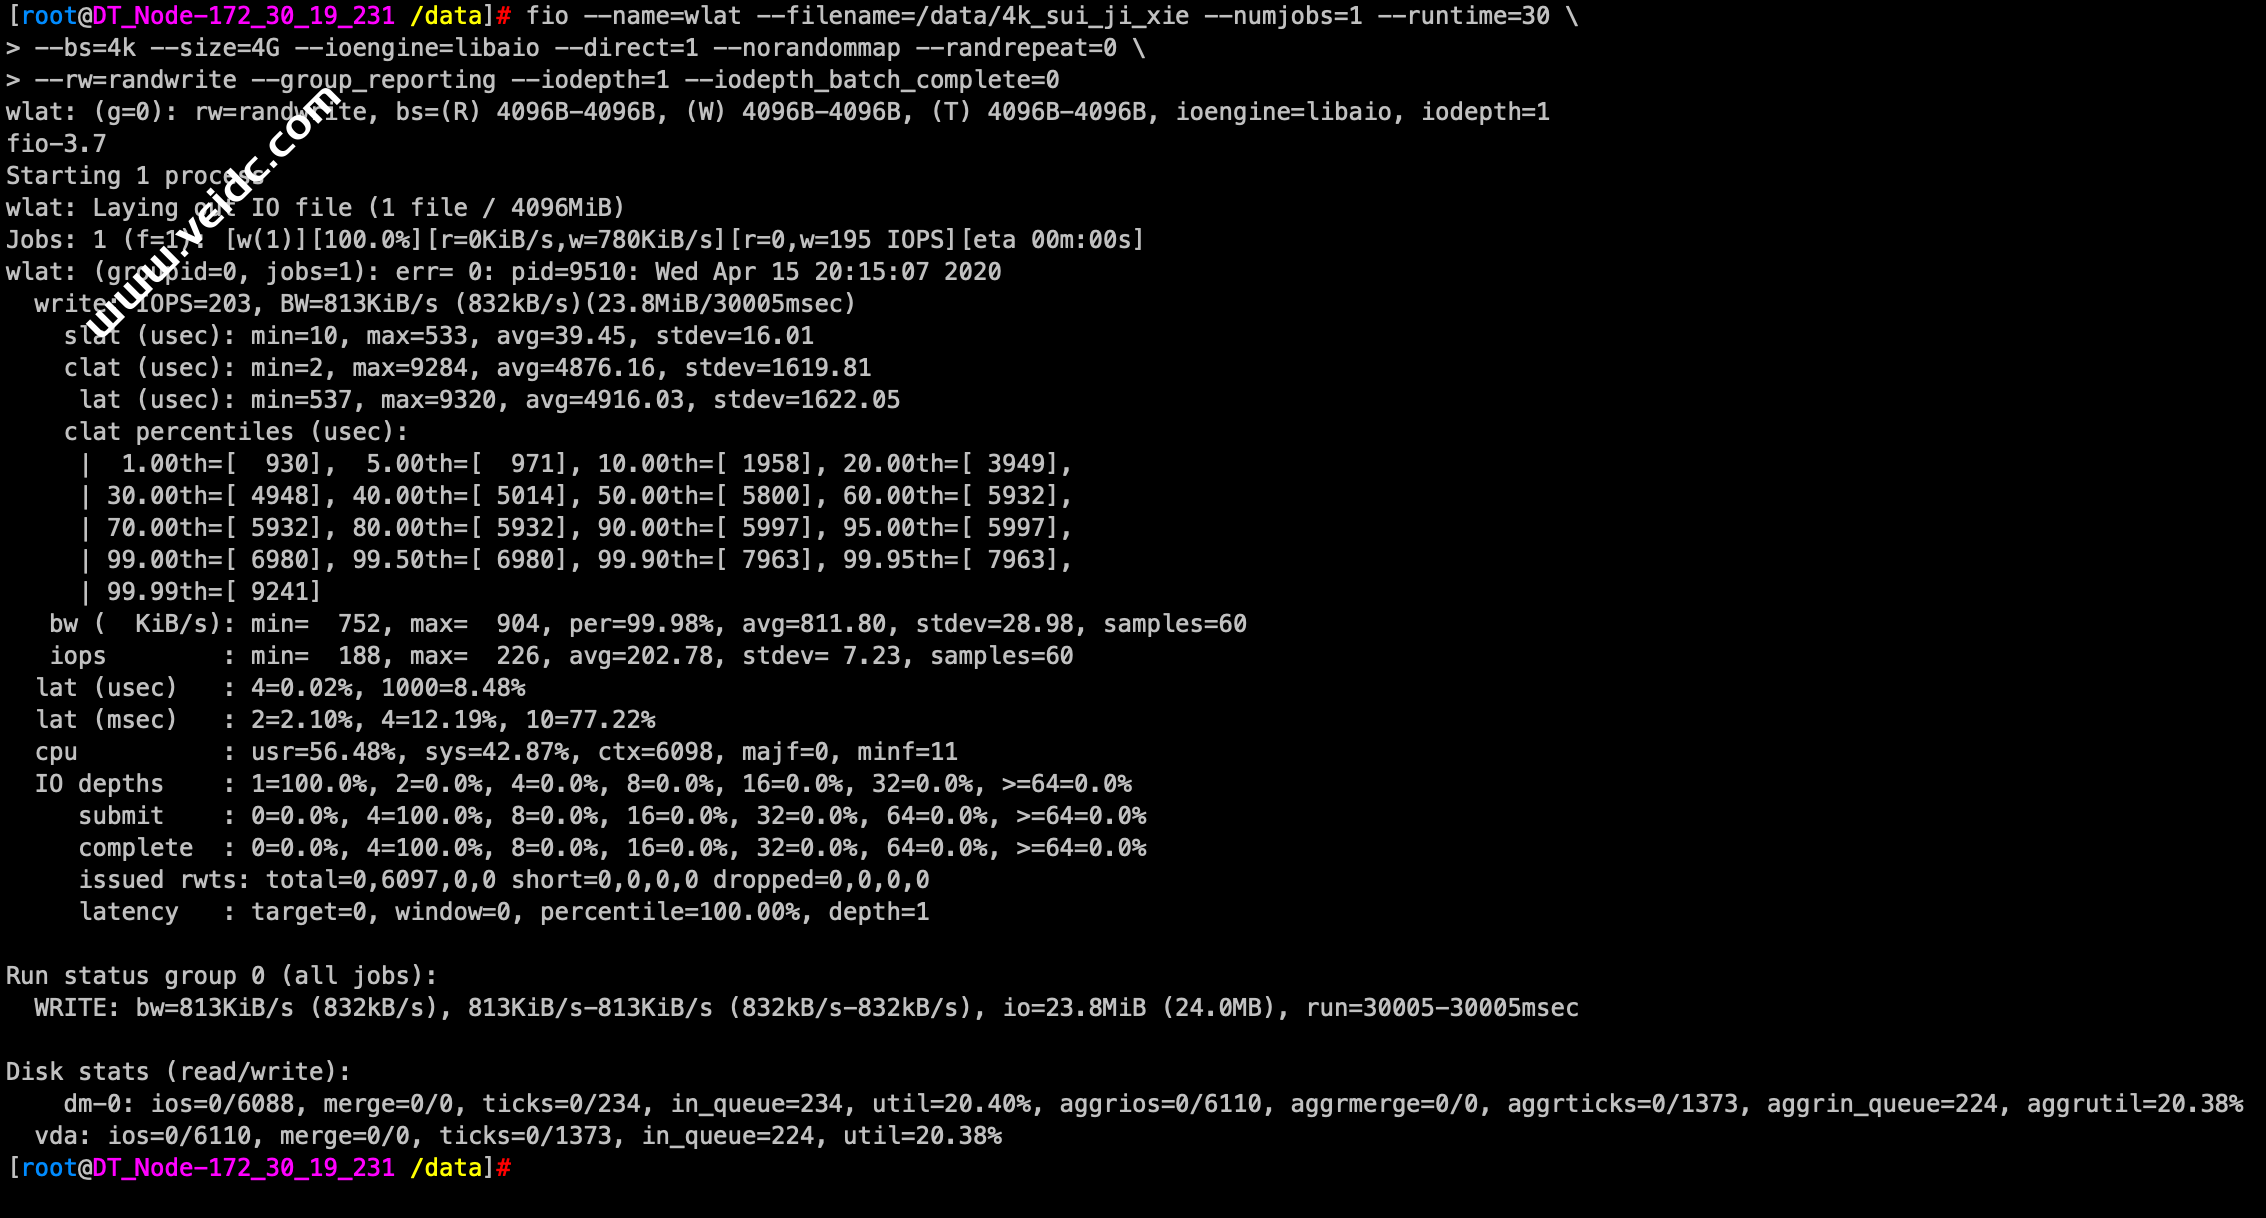
–测试4K 随机写延迟:
[root@DT_Node-172_30_19_231 /data]# fio --name=wlat --filename=/data/4k_sui_ji_xie --numjobs=1 --runtime=30 \
--bs=4k --size=4G --ioengine=libaio --direct=1 --norandommap --randrepeat=0 \
-rw=randwrite --group_reporting --iodepth=1 --iodepth_batch_complete=0
wlat: (g=0): rw=randwrite, bs=(R) 4096B-4096B, (W) 4096B-4096B, (T) 4096B-4096B, ioengine=libaio, iodepth=1
fio-3.7
Starting 1 process
wlat: Laying out IO file (1 file / 4096MiB)
Jobs: 1 (f=1): [w(1)][100.0%][r=0KiB/s,w=780KiB/s][r=0,w=195 IOPS][eta 00m:00s]
wlat: (groupid=0, jobs=1): err= 0: pid=9510: Wed Apr 15 20:15:07 2020
  write: IOPS=203, BW=813KiB/s (832kB/s)(23.8MiB/30005msec)
    slat (usec): min=10, max=533, avg=39.45, stdev=16.01
    clat (usec): min=2, max=9284, avg=4876.16, stdev=1619.81
     lat (usec): min=537, max=9320, avg=4916.03, stdev=1622.05
    clat percentiles (usec):
     |  1.00th=[  930],  5.00th=[  971], 10.00th=[ 1958], 20.00th=[ 3949],
     | 30.00th=[ 4948], 40.00th=[ 5014], 50.00th=[ 5800], 60.00th=[ 5932],
     | 70.00th=[ 5932], 80.00th=[ 5932], 90.00th=[ 5997], 95.00th=[ 5997],
     | 99.00th=[ 6980], 99.50th=[ 6980], 99.90th=[ 7963], 99.95th=[ 7963],
     | 99.99th=[ 9241]
   bw (  KiB/s): min=  752, max=  904, per=99.98%, avg=811.80, stdev=28.98, samples=60
   iops        : min=  188, max=  226, avg=202.78, stdev= 7.23, samples=60
  lat (usec)   : 4=0.02%, 1000=8.48%
  lat (msec)   : 2=2.10%, 4=12.19%, 10=77.22%
  cpu          : usr=56.48%, sys=42.87%, ctx=6098, majf=0, minf=11
  IO depths    : 1=100.0%, 2=0.0%, 4=0.0%, 8=0.0%, 16=0.0%, 32=0.0%, >=64=0.0%
     submit    : 0=0.0%, 4=100.0%, 8=0.0%, 16=0.0%, 32=0.0%, 64=0.0%, >=64=0.0%
     complete  : 0=0.0%, 4=100.0%, 8=0.0%, 16=0.0%, 32=0.0%, 64=0.0%, >=64=0.0%
     issued rwts: total=0,6097,0,0 short=0,0,0,0 dropped=0,0,0,0
     latency   : target=0, window=0, percentile=100.00%, depth=1

Run status group 0 (all jobs):
  WRITE: bw=813KiB/s (832kB/s), 813KiB/s-813KiB/s (832kB/s-832kB/s), io=23.8MiB (24.0MB), run=30005-30005msec

Disk stats (read/write):
    dm-0: ios=0/6088, merge=0/0, ticks=0/234, in_queue=234, util=20.40%, aggrios=0/6110, aggrmerge=0/0, aggrticks=0/1373, aggrin_queue=224, aggrutil=20.38%
  vda: ios=0/6110, merge=0/0, ticks=0/1373, in_queue=224, util=20.38%
[root@DT_Node-172_30_19_231 /data]#
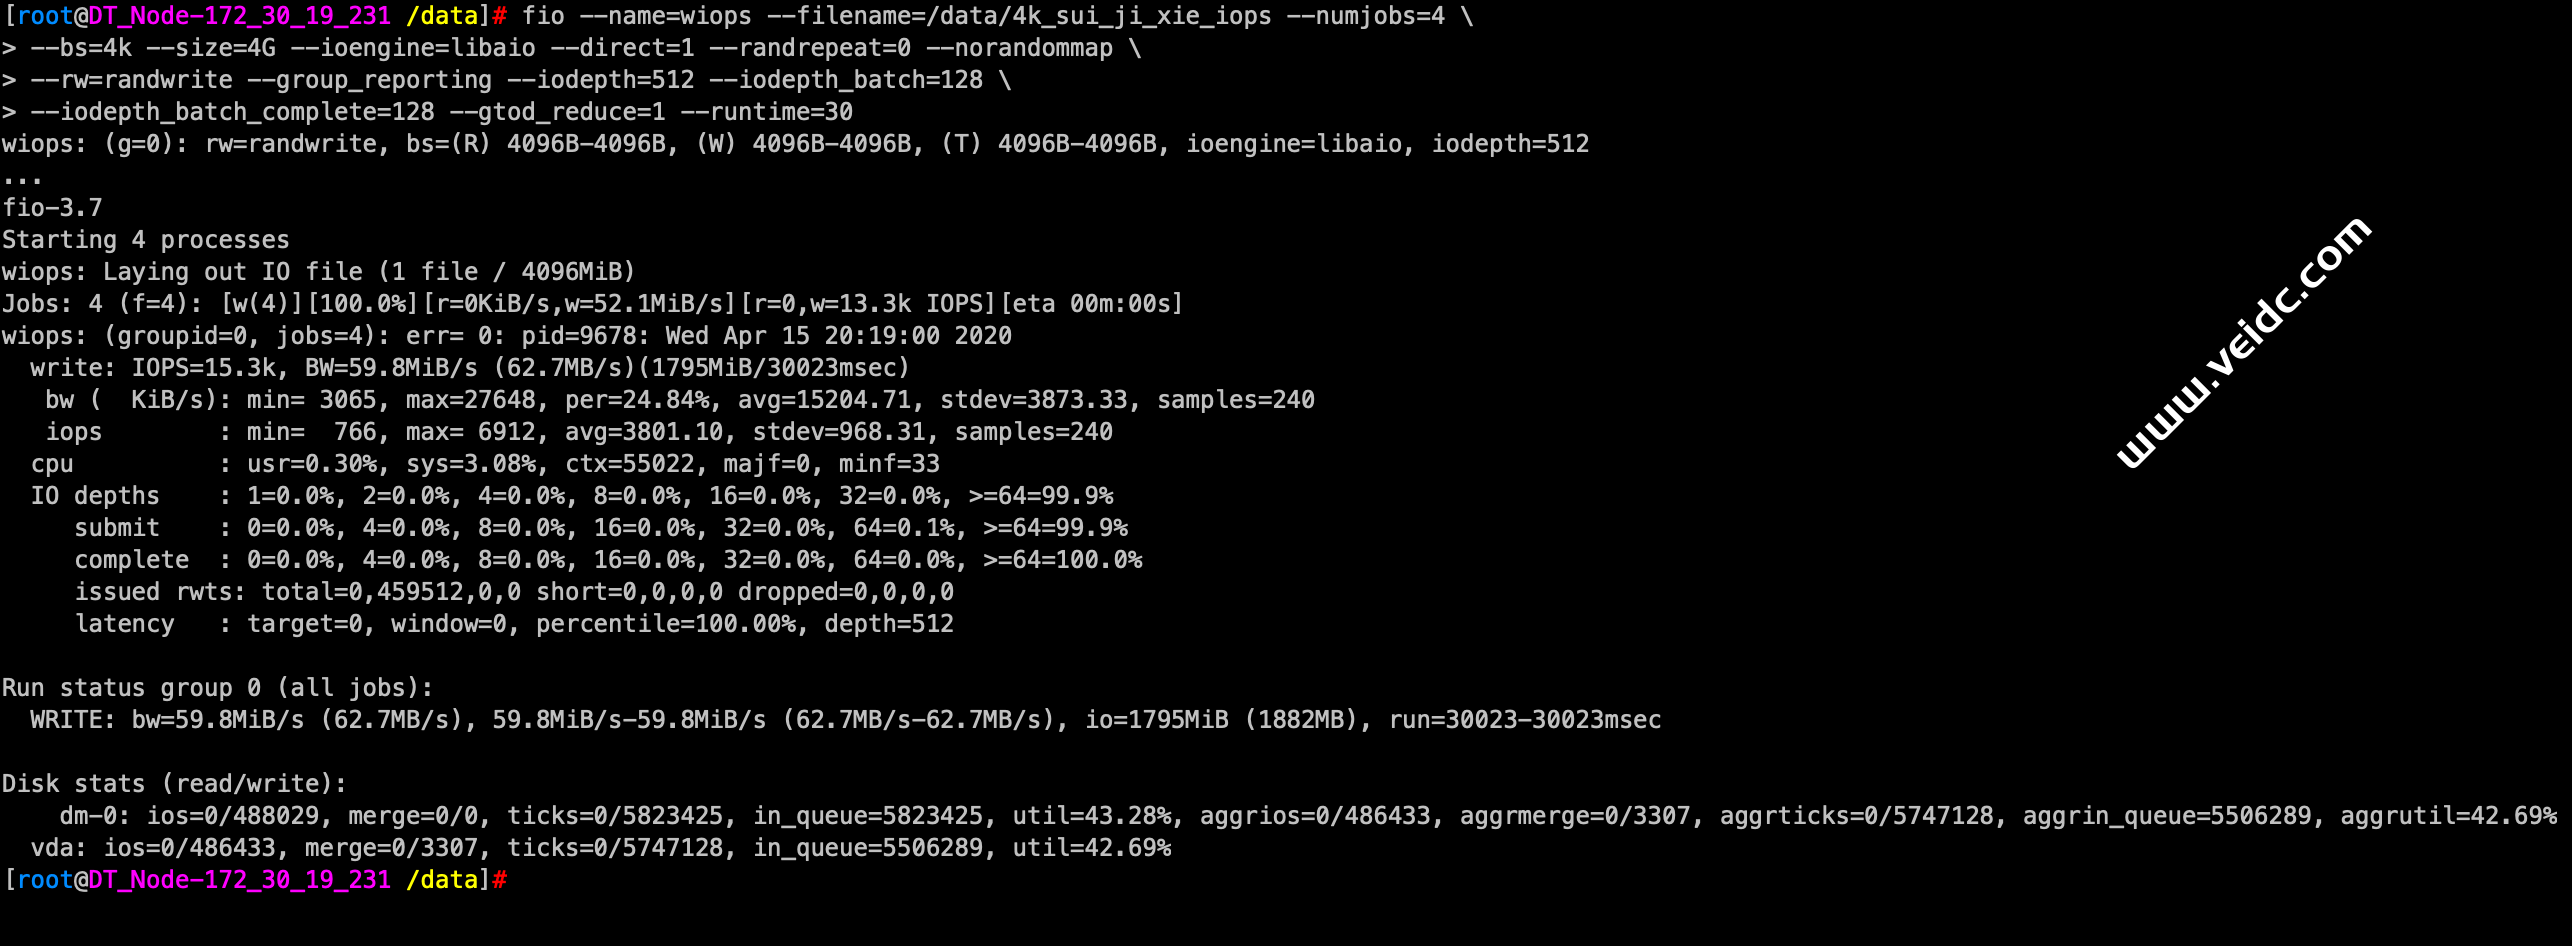
–测试4k 随机写IOPS:
[root@DT_Node-172_30_19_231 /data]# fio --name=wiops --filename=/data/4k_sui_ji_xie_iops --numjobs=4 \
--bs=4k --size=4G --ioengine=libaio --direct=1 --randrepeat=0 --norandommap \
--rw=randwrite --group_reporting --iodepth=512 --iodepth_batch=128 \
--iodepth_batch_complete=128 --gtod_reduce=1 --runtime=30
wiops: (g=0): rw=randwrite, bs=(R) 4096B-4096B, (W) 4096B-4096B, (T) 4096B-4096B, ioengine=libaio, iodepth=512
...
fio-3.7
Starting 4 processes
wiops: Laying out IO file (1 file / 4096MiB)
Jobs: 4 (f=4): [w(4)][100.0%][r=0KiB/s,w=52.1MiB/s][r=0,w=13.3k IOPS][eta 00m:00s]
wiops: (groupid=0, jobs=4): err= 0: pid=9678: Wed Apr 15 20:19:00 2020
  write: IOPS=15.3k, BW=59.8MiB/s (62.7MB/s)(1795MiB/30023msec)
   bw (  KiB/s): min= 3065, max=27648, per=24.84%, avg=15204.71, stdev=3873.33, samples=240
   iops        : min=  766, max= 6912, avg=3801.10, stdev=968.31, samples=240
  cpu          : usr=0.30%, sys=3.08%, ctx=55022, majf=0, minf=33
  IO depths    : 1=0.0%, 2=0.0%, 4=0.0%, 8=0.0%, 16=0.0%, 32=0.0%, >=64=99.9%
     submit    : 0=0.0%, 4=0.0%, 8=0.0%, 16=0.0%, 32=0.0%, 64=0.1%, >=64=99.9%
     complete  : 0=0.0%, 4=0.0%, 8=0.0%, 16=0.0%, 32=0.0%, 64=0.0%, >=64=100.0%
     issued rwts: total=0,459512,0,0 short=0,0,0,0 dropped=0,0,0,0
     latency   : target=0, window=0, percentile=100.00%, depth=512

Run status group 0 (all jobs):
  WRITE: bw=59.8MiB/s (62.7MB/s), 59.8MiB/s-59.8MiB/s (62.7MB/s-62.7MB/s), io=1795MiB (1882MB), run=30023-30023msec

Disk stats (read/write):
    dm-0: ios=0/488029, merge=0/0, ticks=0/5823425, in_queue=5823425, util=43.28%, aggrios=0/486433, aggrmerge=0/3307, aggrticks=0/5747128, aggrin_queue=5506289, aggrutil=42.69%
  vda: ios=0/486433, merge=0/3307, ticks=0/5747128, in_queue=5506289, util=42.69%
[root@DT_Node-172_30_19_231 /data]#
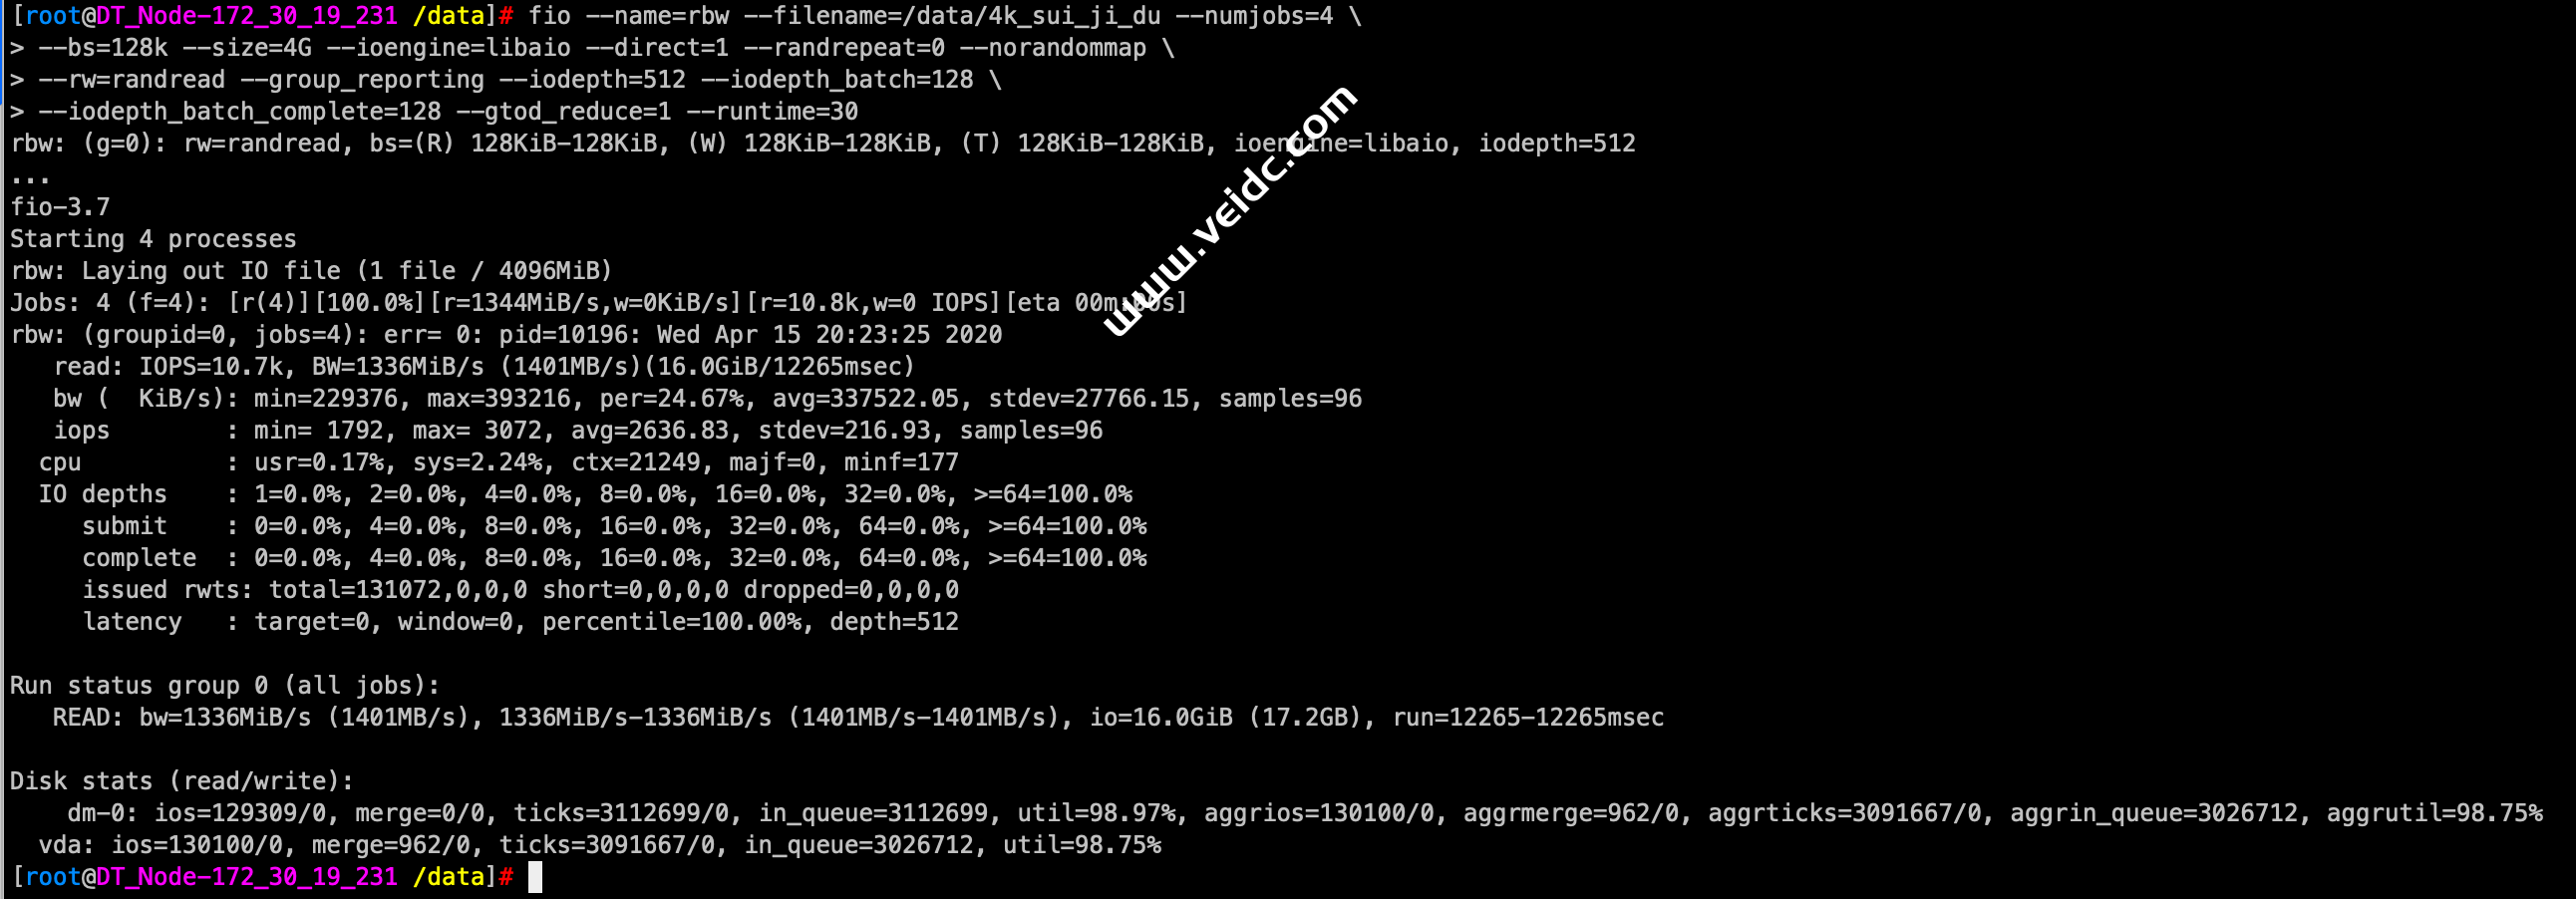
–测试4k 读带宽:
[root@DT_Node-172_30_19_231 /data]# fio --name=rbw --filename=/data/4k_sui_ji_du --numjobs=4 \
--bs=128k --size=4G --ioengine=libaio --direct=1 --randrepeat=0 --norandommap \
--rw=randread --group_reporting --iodepth=512 --iodepth_batch=128 \
--iodepth_batch_complete=128 --gtod_reduce=1 --runtime=30
rbw: (g=0): rw=randread, bs=(R) 128KiB-128KiB, (W) 128KiB-128KiB, (T) 128KiB-128KiB, ioengine=libaio, iodepth=512
...
fio-3.7
Starting 4 processes
rbw: Laying out IO file (1 file / 4096MiB)
Jobs: 4 (f=4): [r(4)][100.0%][r=1344MiB/s,w=0KiB/s][r=10.8k,w=0 IOPS][eta 00m:00s]
rbw: (groupid=0, jobs=4): err= 0: pid=10196: Wed Apr 15 20:23:25 2020
   read: IOPS=10.7k, BW=1336MiB/s (1401MB/s)(16.0GiB/12265msec)
   bw (  KiB/s): min=229376, max=393216, per=24.67%, avg=337522.05, stdev=27766.15, samples=96
   iops        : min= 1792, max= 3072, avg=2636.83, stdev=216.93, samples=96
  cpu          : usr=0.17%, sys=2.24%, ctx=21249, majf=0, minf=177
  IO depths    : 1=0.0%, 2=0.0%, 4=0.0%, 8=0.0%, 16=0.0%, 32=0.0%, >=64=100.0%
     submit    : 0=0.0%, 4=0.0%, 8=0.0%, 16=0.0%, 32=0.0%, 64=0.0%, >=64=100.0%
     complete  : 0=0.0%, 4=0.0%, 8=0.0%, 16=0.0%, 32=0.0%, 64=0.0%, >=64=100.0%
     issued rwts: total=131072,0,0,0 short=0,0,0,0 dropped=0,0,0,0
     latency   : target=0, window=0, percentile=100.00%, depth=512

Run status group 0 (all jobs):
   READ: bw=1336MiB/s (1401MB/s), 1336MiB/s-1336MiB/s (1401MB/s-1401MB/s), io=16.0GiB (17.2GB), run=12265-12265msec

Disk stats (read/write):
    dm-0: ios=129309/0, merge=0/0, ticks=3112699/0, in_queue=3112699, util=98.97%, aggrios=130100/0, aggrmerge=962/0, aggrticks=3091667/0, aggrin_queue=3026712, aggrutil=98.75%
  vda: ios=130100/0, merge=962/0, ticks=3091667/0, in_queue=3026712, util=98.75%
[root@DT_Node-172_30_19_231 /data]#
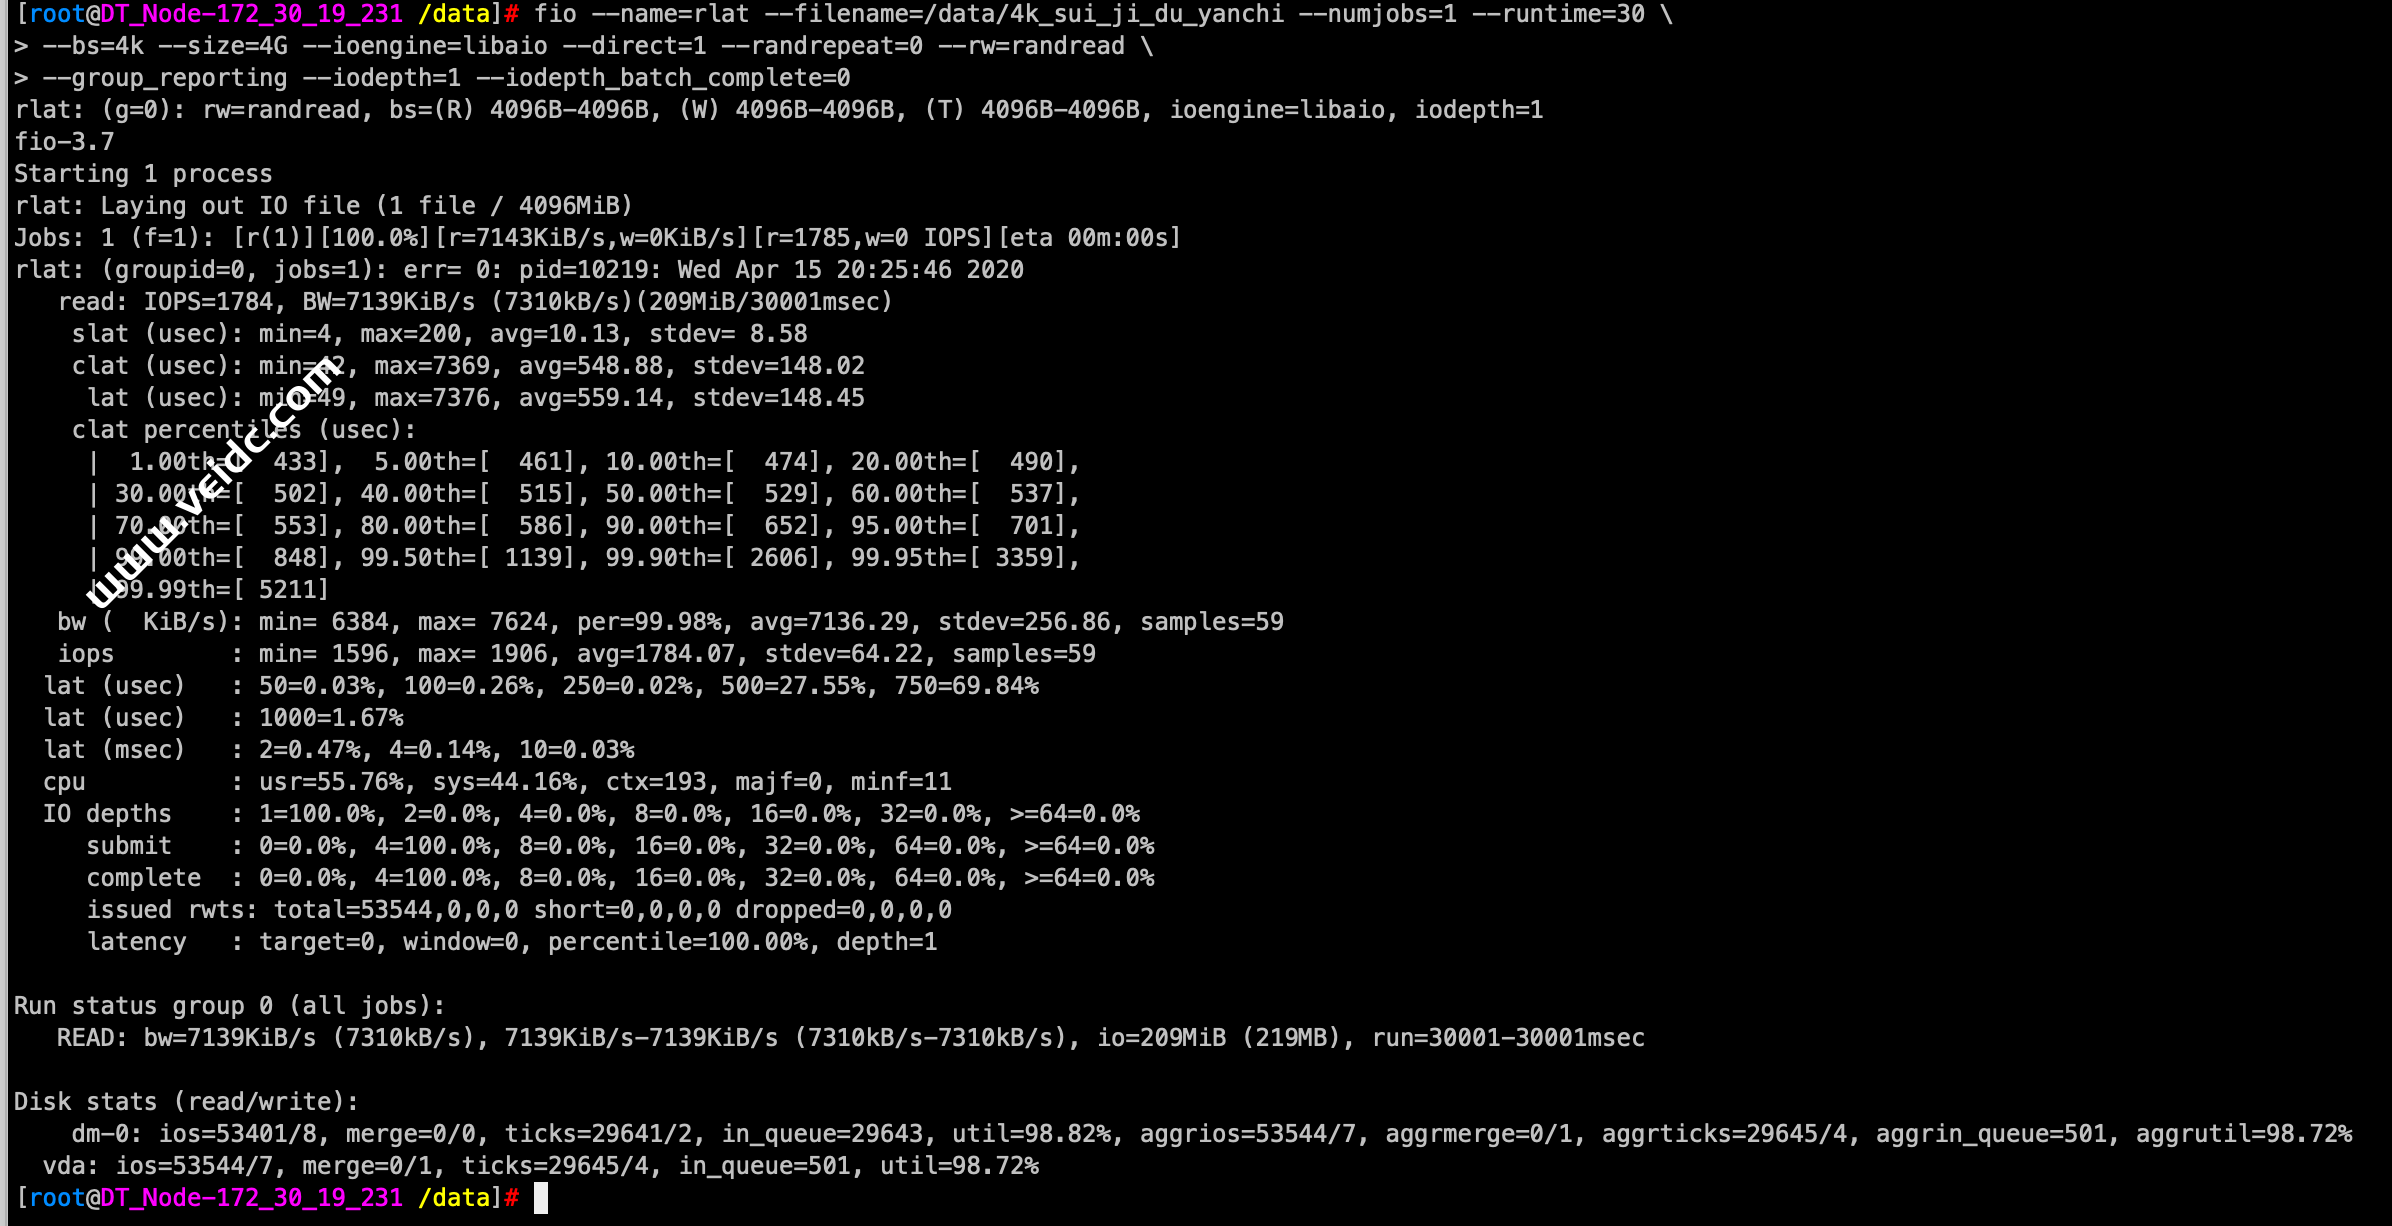
–测试4k 随机读延迟:
[root@DT_Node-172_30_19_231 /data]# fio --name=rlat --filename=/data/4k_sui_ji_du_yanchi --numjobs=1 --runtime=30 \
--bs=4k --size=4G --ioengine=libaio --direct=1 --randrepeat=0 --rw=randread \
--group_reporting --iodepth=1 --iodepth_batch_complete=0
rlat: (g=0): rw=randread, bs=(R) 4096B-4096B, (W) 4096B-4096B, (T) 4096B-4096B, ioengine=libaio, iodepth=1
fio-3.7
Starting 1 process
rlat: Laying out IO file (1 file / 4096MiB)
Jobs: 1 (f=1): [r(1)][100.0%][r=7143KiB/s,w=0KiB/s][r=1785,w=0 IOPS][eta 00m:00s]
rlat: (groupid=0, jobs=1): err= 0: pid=10219: Wed Apr 15 20:25:46 2020
   read: IOPS=1784, BW=7139KiB/s (7310kB/s)(209MiB/30001msec)
    slat (usec): min=4, max=200, avg=10.13, stdev= 8.58
    clat (usec): min=42, max=7369, avg=548.88, stdev=148.02
     lat (usec): min=49, max=7376, avg=559.14, stdev=148.45
    clat percentiles (usec):
     |  1.00th=[  433],  5.00th=[  461], 10.00th=[  474], 20.00th=[  490],
     | 30.00th=[  502], 40.00th=[  515], 50.00th=[  529], 60.00th=[  537],
     | 70.00th=[  553], 80.00th=[  586], 90.00th=[  652], 95.00th=[  701],
     | 99.00th=[  848], 99.50th=[ 1139], 99.90th=[ 2606], 99.95th=[ 3359],
     | 99.99th=[ 5211]
   bw (  KiB/s): min= 6384, max= 7624, per=99.98%, avg=7136.29, stdev=256.86, samples=59
   iops        : min= 1596, max= 1906, avg=1784.07, stdev=64.22, samples=59
  lat (usec)   : 50=0.03%, 100=0.26%, 250=0.02%, 500=27.55%, 750=69.84%
  lat (usec)   : 1000=1.67%
  lat (msec)   : 2=0.47%, 4=0.14%, 10=0.03%
  cpu          : usr=55.76%, sys=44.16%, ctx=193, majf=0, minf=11
  IO depths    : 1=100.0%, 2=0.0%, 4=0.0%, 8=0.0%, 16=0.0%, 32=0.0%, >=64=0.0%
     submit    : 0=0.0%, 4=100.0%, 8=0.0%, 16=0.0%, 32=0.0%, 64=0.0%, >=64=0.0%
     complete  : 0=0.0%, 4=100.0%, 8=0.0%, 16=0.0%, 32=0.0%, 64=0.0%, >=64=0.0%
     issued rwts: total=53544,0,0,0 short=0,0,0,0 dropped=0,0,0,0
     latency   : target=0, window=0, percentile=100.00%, depth=1

Run status group 0 (all jobs):
   READ: bw=7139KiB/s (7310kB/s), 7139KiB/s-7139KiB/s (7310kB/s-7310kB/s), io=209MiB (219MB), run=30001-30001msec

Disk stats (read/write):
    dm-0: ios=53401/8, merge=0/0, ticks=29641/2, in_queue=29643, util=98.82%, aggrios=53544/7, aggrmerge=0/1, aggrticks=29645/4, aggrin_queue=501, aggrutil=98.72%
  vda: ios=53544/7, merge=0/1, ticks=29645/4, in_queue=501, util=98.72%
[root@DT_Node-172_30_19_231 /data]#
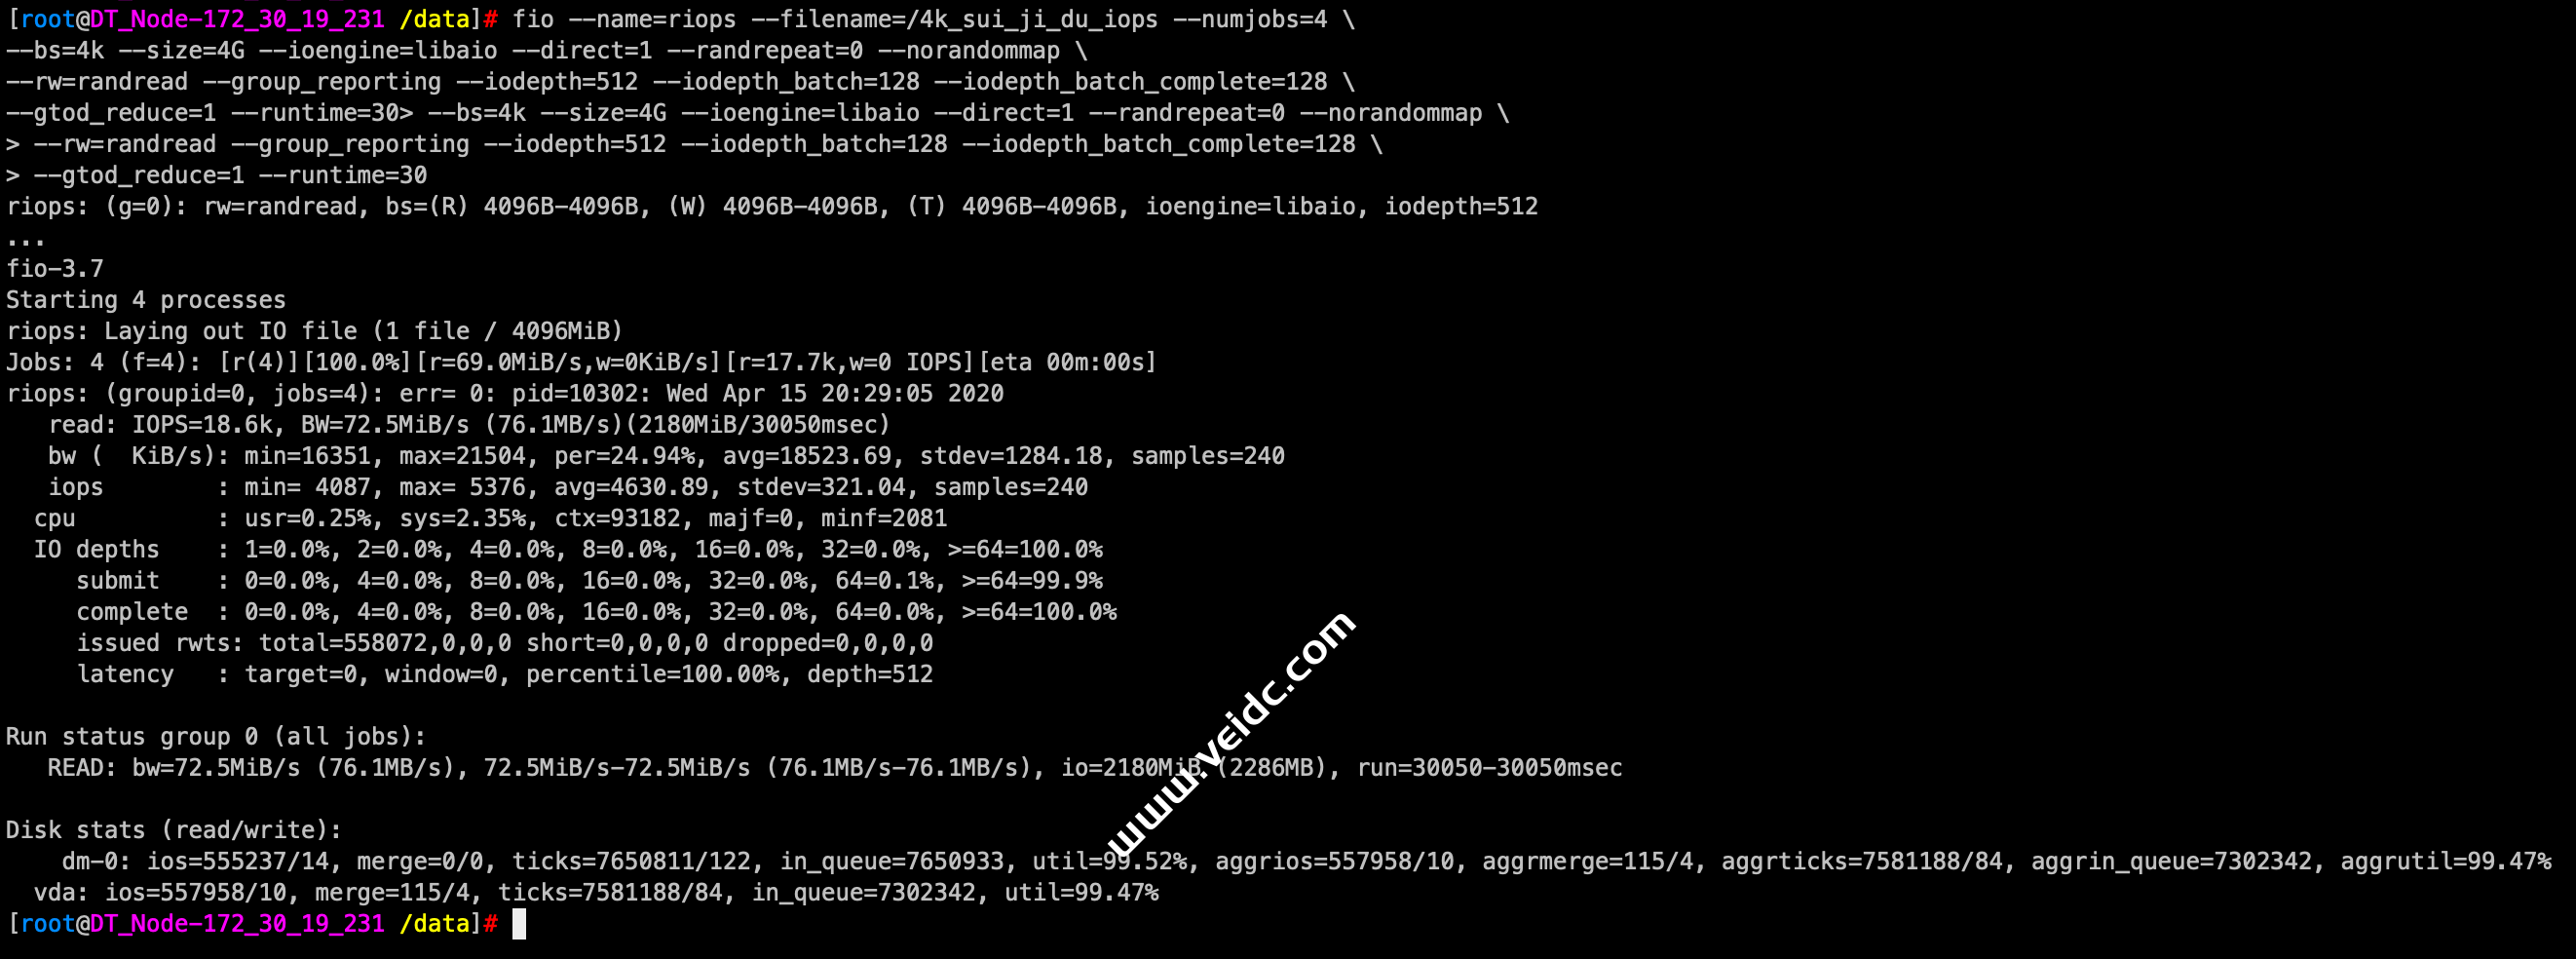
–测试4k 随机读IOPS:
[root@DT_Node-172_30_19_231 /data]# fio --name=riops --filename=/data/4k_sui_ji_du_iops --numjobs=4 \
--bs=4k --size=4G --ioengine=libaio --direct=1 --randrepeat=0 --norandommap --rw=randread \
--group_reporting --iodepth=512 --iodepth_batch=128 --iodepth_batch_complete=128 --gtod_reduce=1 --runtime=30
riops: (g=0): rw=randread, bs=(R) 4096B-4096B, (W) 4096B-4096B, (T) 4096B-4096B, ioengine=libaio, iodepth=512
...
fio-3.7
Starting 4 processes
riops: Laying out IO file (1 file / 4096MiB)
Jobs: 4 (f=4): [r(4)][100.0%][r=69.0MiB/s,w=0KiB/s][r=17.7k,w=0 IOPS][eta 00m:00s]
riops: (groupid=0, jobs=4): err= 0: pid=10302: Wed Apr 15 20:29:05 2020
   read: IOPS=18.6k, BW=72.5MiB/s (76.1MB/s)(2180MiB/30050msec)
   bw (  KiB/s): min=16351, max=21504, per=24.94%, avg=18523.69, stdev=1284.18, samples=240
   iops        : min= 4087, max= 5376, avg=4630.89, stdev=321.04, samples=240
  cpu          : usr=0.25%, sys=2.35%, ctx=93182, majf=0, minf=2081
  IO depths    : 1=0.0%, 2=0.0%, 4=0.0%, 8=0.0%, 16=0.0%, 32=0.0%, >=64=100.0%
     submit    : 0=0.0%, 4=0.0%, 8=0.0%, 16=0.0%, 32=0.0%, 64=0.1%, >=64=99.9%
     complete  : 0=0.0%, 4=0.0%, 8=0.0%, 16=0.0%, 32=0.0%, 64=0.0%, >=64=100.0%
     issued rwts: total=558072,0,0,0 short=0,0,0,0 dropped=0,0,0,0
     latency   : target=0, window=0, percentile=100.00%, depth=512

Run status group 0 (all jobs):
   READ: bw=72.5MiB/s (76.1MB/s), 72.5MiB/s-72.5MiB/s (76.1MB/s-76.1MB/s), io=2180MiB (2286MB), run=30050-30050msec

Disk stats (read/write):
    dm-0: ios=555237/14, merge=0/0, ticks=7650811/122, in_queue=7650933, util=99.52%, aggrios=557958/10, aggrmerge=115/4, aggrticks=7581188/84, aggrin_queue=7302342, aggrutil=99.47%
  vda: ios=557958/10, merge=115/4, ticks=7581188/84, in_queue=7302342, util=99.47%
[root@DT_Node-172_30_19_231 /data]#
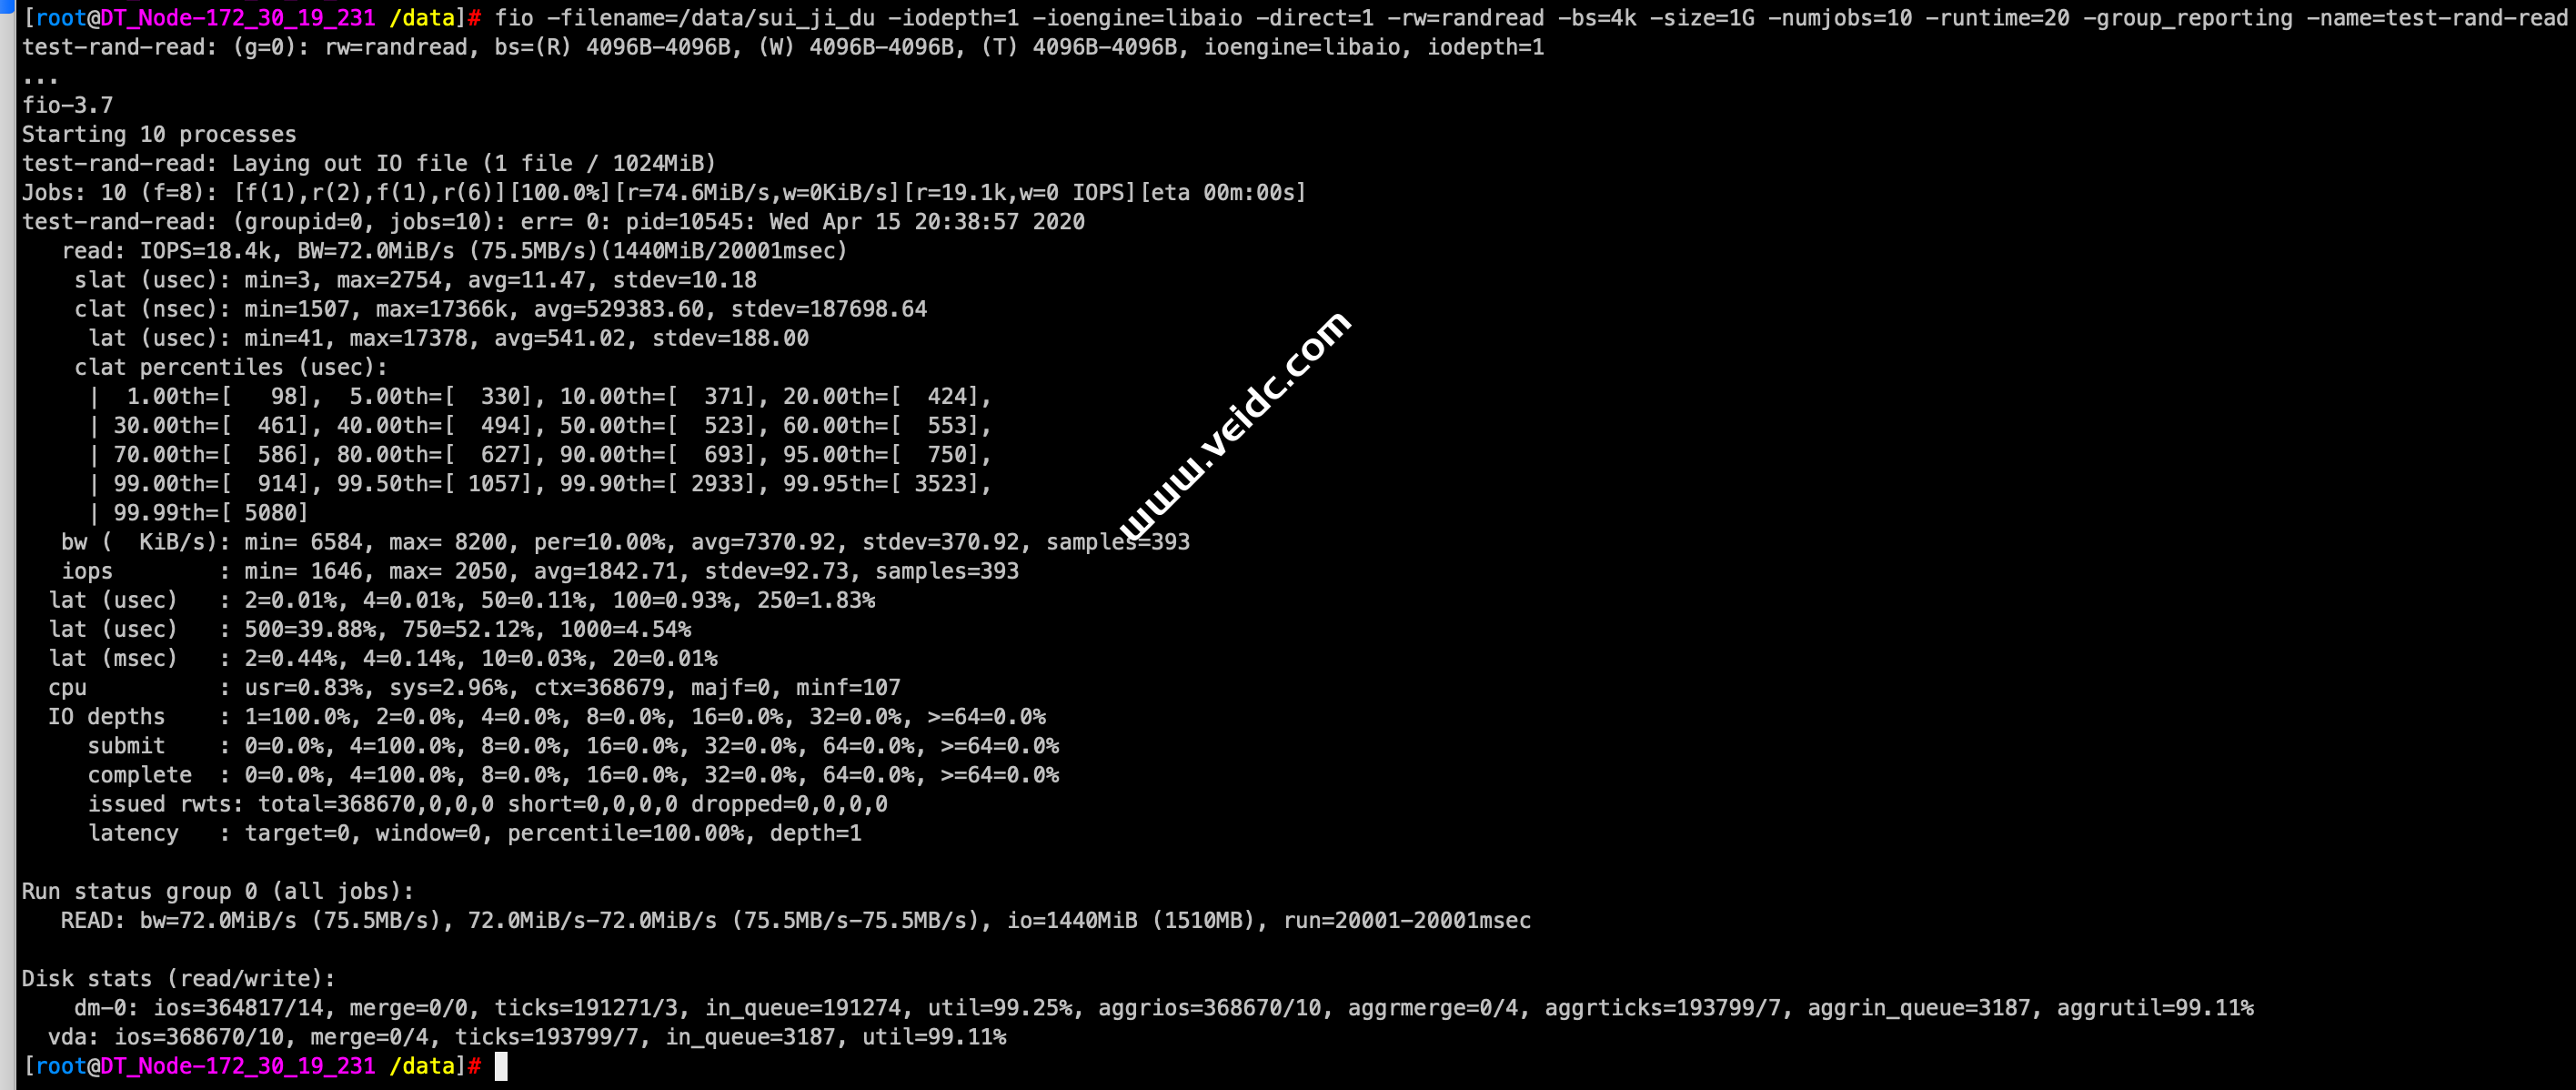
–随机读:
[root@DT_Node-172_30_19_231 /data]# fio -filename=/data/sui_ji_du -iodepth=1 -ioengine=libaio -direct=1 -rw=randread -bs=4k -size=1G -numjobs=10 -runtime=20 -group_reporting -name=test-rand-read
test-rand-read: (g=0): rw=randread, bs=(R) 4096B-4096B, (W) 4096B-4096B, (T) 4096B-4096B, ioengine=libaio, iodepth=1
...
fio-3.7
Starting 10 processes
test-rand-read: Laying out IO file (1 file / 1024MiB)
Jobs: 10 (f=8): [f(1),r(2),f(1),r(6)][100.0%][r=74.6MiB/s,w=0KiB/s][r=19.1k,w=0 IOPS][eta 00m:00s]
test-rand-read: (groupid=0, jobs=10): err= 0: pid=10545: Wed Apr 15 20:38:57 2020
   read: IOPS=18.4k, BW=72.0MiB/s (75.5MB/s)(1440MiB/20001msec)
    slat (usec): min=3, max=2754, avg=11.47, stdev=10.18
    clat (nsec): min=1507, max=17366k, avg=529383.60, stdev=187698.64
     lat (usec): min=41, max=17378, avg=541.02, stdev=188.00
    clat percentiles (usec):
     |  1.00th=[   98],  5.00th=[  330], 10.00th=[  371], 20.00th=[  424],
     | 30.00th=[  461], 40.00th=[  494], 50.00th=[  523], 60.00th=[  553],
     | 70.00th=[  586], 80.00th=[  627], 90.00th=[  693], 95.00th=[  750],
     | 99.00th=[  914], 99.50th=[ 1057], 99.90th=[ 2933], 99.95th=[ 3523],
     | 99.99th=[ 5080]
   bw (  KiB/s): min= 6584, max= 8200, per=10.00%, avg=7370.92, stdev=370.92, samples=393
   iops        : min= 1646, max= 2050, avg=1842.71, stdev=92.73, samples=393
  lat (usec)   : 2=0.01%, 4=0.01%, 50=0.11%, 100=0.93%, 250=1.83%
  lat (usec)   : 500=39.88%, 750=52.12%, 1000=4.54%
  lat (msec)   : 2=0.44%, 4=0.14%, 10=0.03%, 20=0.01%
  cpu          : usr=0.83%, sys=2.96%, ctx=368679, majf=0, minf=107
  IO depths    : 1=100.0%, 2=0.0%, 4=0.0%, 8=0.0%, 16=0.0%, 32=0.0%, >=64=0.0%
     submit    : 0=0.0%, 4=100.0%, 8=0.0%, 16=0.0%, 32=0.0%, 64=0.0%, >=64=0.0%
     complete  : 0=0.0%, 4=100.0%, 8=0.0%, 16=0.0%, 32=0.0%, 64=0.0%, >=64=0.0%
     issued rwts: total=368670,0,0,0 short=0,0,0,0 dropped=0,0,0,0
     latency   : target=0, window=0, percentile=100.00%, depth=1

Run status group 0 (all jobs):
   READ: bw=72.0MiB/s (75.5MB/s), 72.0MiB/s-72.0MiB/s (75.5MB/s-75.5MB/s), io=1440MiB (1510MB), run=20001-20001msec

Disk stats (read/write):
    dm-0: ios=364817/14, merge=0/0, ticks=191271/3, in_queue=191274, util=99.25%, aggrios=368670/10, aggrmerge=0/4, aggrticks=193799/7, aggrin_queue=3187, aggrutil=99.11%
  vda: ios=368670/10, merge=0/4, ticks=193799/7, in_queue=3187, util=99.11%
[root@DT_Node-172_30_19_231 /data]#
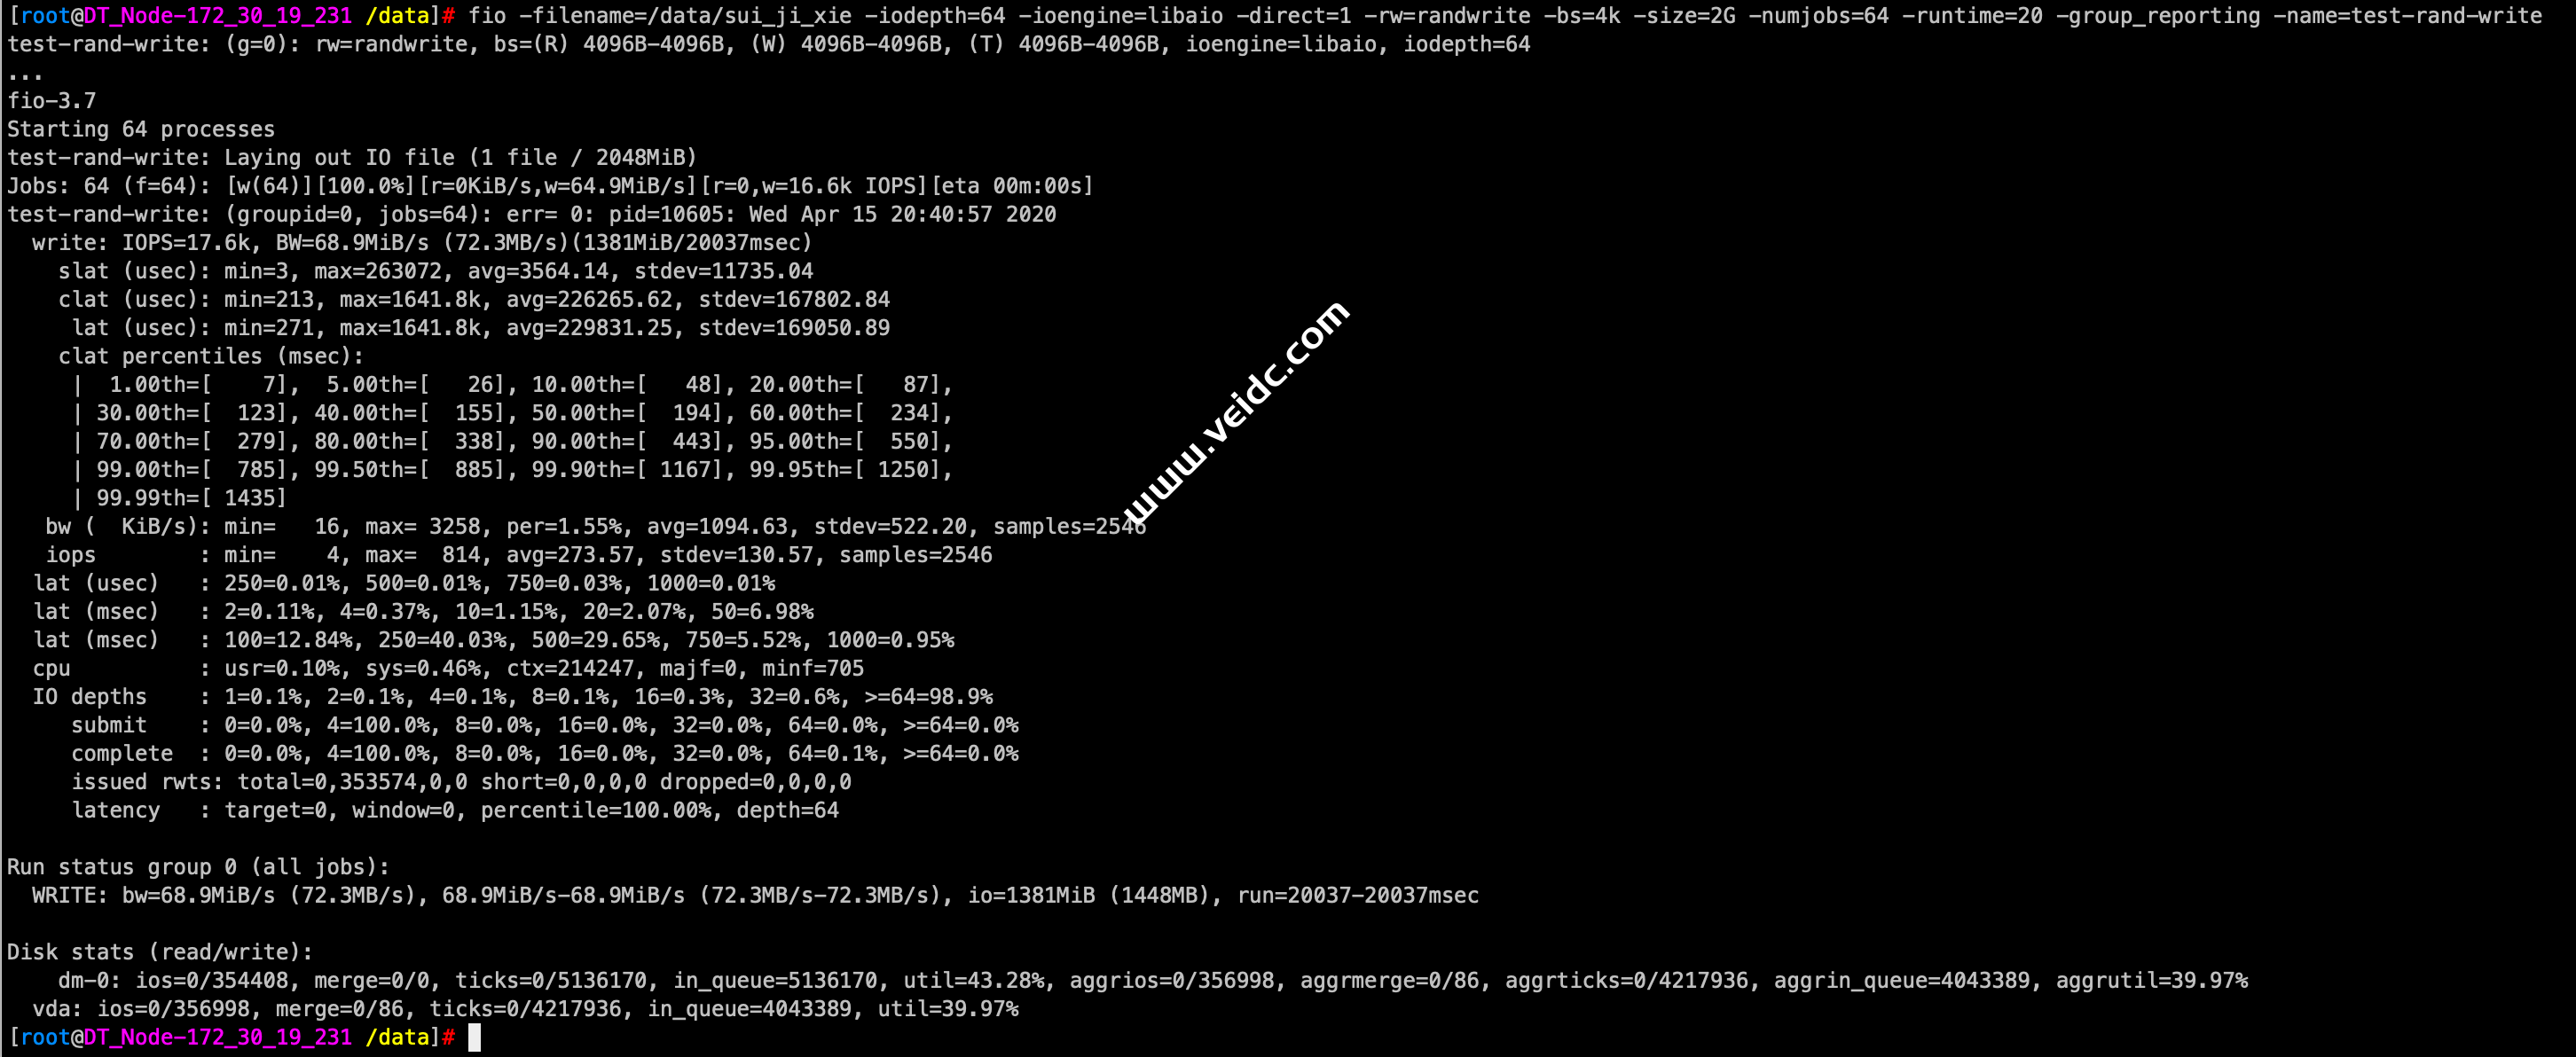
–随机写:
[root@DT_Node-172_30_19_231 /data]# fio -filename=/data/sui_ji_xie -iodepth=64 -ioengine=libaio -direct=1 -rw=randwrite -bs=4k -size=2G -numjobs=64 -runtime=20 -group_reporting -name=test-rand-write
test-rand-write: (g=0): rw=randwrite, bs=(R) 4096B-4096B, (W) 4096B-4096B, (T) 4096B-4096B, ioengine=libaio, iodepth=64
...
fio-3.7
Starting 64 processes
test-rand-write: Laying out IO file (1 file / 2048MiB)
Jobs: 64 (f=64): [w(64)][100.0%][r=0KiB/s,w=64.9MiB/s][r=0,w=16.6k IOPS][eta 00m:00s]
test-rand-write: (groupid=0, jobs=64): err= 0: pid=10605: Wed Apr 15 20:40:57 2020
  write: IOPS=17.6k, BW=68.9MiB/s (72.3MB/s)(1381MiB/20037msec)
    slat (usec): min=3, max=263072, avg=3564.14, stdev=11735.04
    clat (usec): min=213, max=1641.8k, avg=226265.62, stdev=167802.84
     lat (usec): min=271, max=1641.8k, avg=229831.25, stdev=169050.89
    clat percentiles (msec):
     |  1.00th=[    7],  5.00th=[   26], 10.00th=[   48], 20.00th=[   87],
     | 30.00th=[  123], 40.00th=[  155], 50.00th=[  194], 60.00th=[  234],
     | 70.00th=[  279], 80.00th=[  338], 90.00th=[  443], 95.00th=[  550],
     | 99.00th=[  785], 99.50th=[  885], 99.90th=[ 1167], 99.95th=[ 1250],
     | 99.99th=[ 1435]
   bw (  KiB/s): min=   16, max= 3258, per=1.55%, avg=1094.63, stdev=522.20, samples=2546
   iops        : min=    4, max=  814, avg=273.57, stdev=130.57, samples=2546
  lat (usec)   : 250=0.01%, 500=0.01%, 750=0.03%, 1000=0.01%
  lat (msec)   : 2=0.11%, 4=0.37%, 10=1.15%, 20=2.07%, 50=6.98%
  lat (msec)   : 100=12.84%, 250=40.03%, 500=29.65%, 750=5.52%, 1000=0.95%
  cpu          : usr=0.10%, sys=0.46%, ctx=214247, majf=0, minf=705
  IO depths    : 1=0.1%, 2=0.1%, 4=0.1%, 8=0.1%, 16=0.3%, 32=0.6%, >=64=98.9%
     submit    : 0=0.0%, 4=100.0%, 8=0.0%, 16=0.0%, 32=0.0%, 64=0.0%, >=64=0.0%
     complete  : 0=0.0%, 4=100.0%, 8=0.0%, 16=0.0%, 32=0.0%, 64=0.1%, >=64=0.0%
     issued rwts: total=0,353574,0,0 short=0,0,0,0 dropped=0,0,0,0
     latency   : target=0, window=0, percentile=100.00%, depth=64

Run status group 0 (all jobs):
  WRITE: bw=68.9MiB/s (72.3MB/s), 68.9MiB/s-68.9MiB/s (72.3MB/s-72.3MB/s), io=1381MiB (1448MB), run=20037-20037msec

Disk stats (read/write):
    dm-0: ios=0/354408, merge=0/0, ticks=0/5136170, in_queue=5136170, util=43.28%, aggrios=0/356998, aggrmerge=0/86, aggrticks=0/4217936, aggrin_queue=4043389, aggrutil=39.97%
  vda: ios=0/356998, merge=0/86, ticks=0/4217936, in_queue=4043389, util=39.97%
[root@DT_Node-172_30_19_231 /data]#
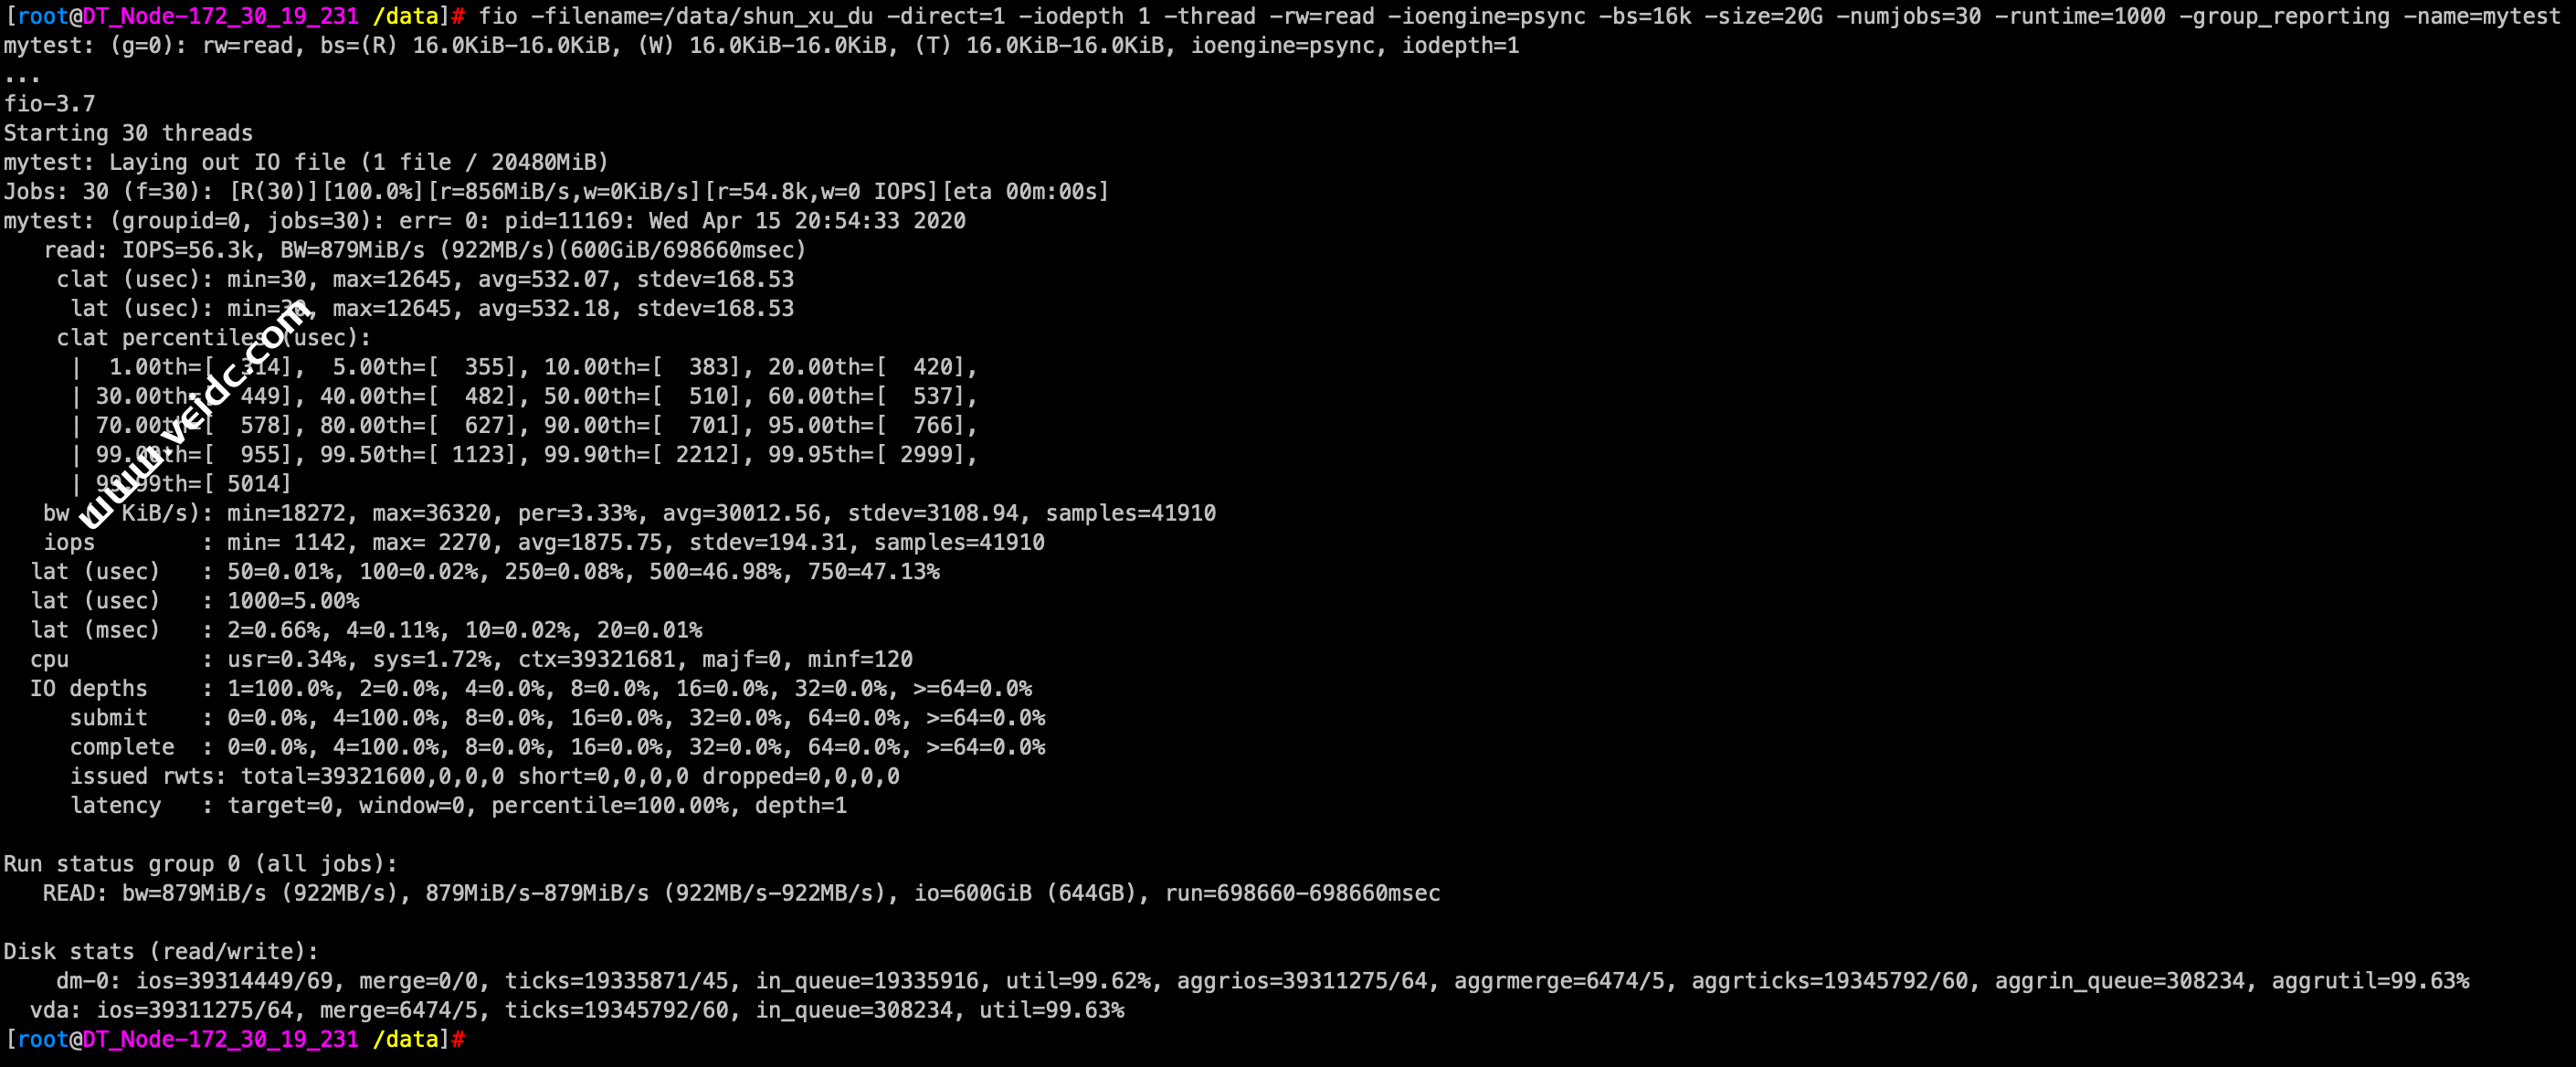
–顺序读:
[root@DT_Node-172_30_19_231 /data]# fio -filename=/data/shun_xu_du -direct=1 -iodepth 1 -thread -rw=read -ioengine=psync -bs=16k -size=20G -numjobs=30 -runtime=1000 -group_reporting -name=mytest
mytest: (g=0): rw=read, bs=(R) 16.0KiB-16.0KiB, (W) 16.0KiB-16.0KiB, (T) 16.0KiB-16.0KiB, ioengine=psync, iodepth=1
...
fio-3.7
Starting 30 threads
mytest: Laying out IO file (1 file / 20480MiB)
Jobs: 30 (f=30): [R(30)][100.0%][r=856MiB/s,w=0KiB/s][r=54.8k,w=0 IOPS][eta 00m:00s]
mytest: (groupid=0, jobs=30): err= 0: pid=11169: Wed Apr 15 20:54:33 2020
   read: IOPS=56.3k, BW=879MiB/s (922MB/s)(600GiB/698660msec)
    clat (usec): min=30, max=12645, avg=532.07, stdev=168.53
     lat (usec): min=30, max=12645, avg=532.18, stdev=168.53
    clat percentiles (usec):
     |  1.00th=[  314],  5.00th=[  355], 10.00th=[  383], 20.00th=[  420],
     | 30.00th=[  449], 40.00th=[  482], 50.00th=[  510], 60.00th=[  537],
     | 70.00th=[  578], 80.00th=[  627], 90.00th=[  701], 95.00th=[  766],
     | 99.00th=[  955], 99.50th=[ 1123], 99.90th=[ 2212], 99.95th=[ 2999],
     | 99.99th=[ 5014]
   bw (  KiB/s): min=18272, max=36320, per=3.33%, avg=30012.56, stdev=3108.94, samples=41910
   iops        : min= 1142, max= 2270, avg=1875.75, stdev=194.31, samples=41910
  lat (usec)   : 50=0.01%, 100=0.02%, 250=0.08%, 500=46.98%, 750=47.13%
  lat (usec)   : 1000=5.00%
  lat (msec)   : 2=0.66%, 4=0.11%, 10=0.02%, 20=0.01%
  cpu          : usr=0.34%, sys=1.72%, ctx=39321681, majf=0, minf=120
  IO depths    : 1=100.0%, 2=0.0%, 4=0.0%, 8=0.0%, 16=0.0%, 32=0.0%, >=64=0.0%
     submit    : 0=0.0%, 4=100.0%, 8=0.0%, 16=0.0%, 32=0.0%, 64=0.0%, >=64=0.0%
     complete  : 0=0.0%, 4=100.0%, 8=0.0%, 16=0.0%, 32=0.0%, 64=0.0%, >=64=0.0%
     issued rwts: total=39321600,0,0,0 short=0,0,0,0 dropped=0,0,0,0
     latency   : target=0, window=0, percentile=100.00%, depth=1

Run status group 0 (all jobs):
   READ: bw=879MiB/s (922MB/s), 879MiB/s-879MiB/s (922MB/s-922MB/s), io=600GiB (644GB), run=698660-698660msec

Disk stats (read/write):
    dm-0: ios=39314449/69, merge=0/0, ticks=19335871/45, in_queue=19335916, util=99.62%, aggrios=39311275/64, aggrmerge=6474/5, aggrticks=19345792/60, aggrin_queue=308234, aggrutil=99.63%
  vda: ios=39311275/64, merge=6474/5, ticks=19345792/60, in_queue=308234, util=99.63%
[root@DT_Node-172_30_19_231 /data]#
–混合随机读写:
[root@DT_Node-172_30_19_231 /data]# fio -filename=/data/hun_he_du_xie -direct=1 -iodepth 1 -thread -rw=randrw -rwmixread=70 -ioengine=psync -bs=16k -size=10G -numjobs=30 -runtime=100 -group_reporting -name=mytest -ioscheduler=noop
mytest: (g=0): rw=randrw, bs=(R) 16.0KiB-16.0KiB, (W) 16.0KiB-16.0KiB, (T) 16.0KiB-16.0KiB, ioengine=psync, iodepth=1
...
fio-3.7
Starting 30 threads
mytest: Laying out IO file (1 file / 10240MiB)
Jobs: 27 (f=27): [E(1),m(6),E(1),m(18),E(1),m(3)][100.0%][r=182MiB/s,w=78.3MiB/s][r=11.7k,w=5013 IOPS][eta 00m:00s]
mytest: (groupid=0, jobs=30): err= 0: pid=11322: Wed Apr 15 20:59:20 2020
   read: IOPS=11.5k, BW=180MiB/s (189MB/s)(17.6GiB/100002msec)
    clat (usec): min=188, max=83792, avg=1964.63, stdev=669.45
     lat (usec): min=188, max=83792, avg=1964.76, stdev=669.45
    clat percentiles (usec):
     |  1.00th=[ 1057],  5.00th=[ 1336], 10.00th=[ 1467], 20.00th=[ 1631],
     | 30.00th=[ 1745], 40.00th=[ 1844], 50.00th=[ 1942], 60.00th=[ 2024],
     | 70.00th=[ 2147], 80.00th=[ 2278], 90.00th=[ 2474], 95.00th=[ 2638],
     | 99.00th=[ 3064], 99.50th=[ 3359], 99.90th=[ 5211], 99.95th=[ 6390],
     | 99.99th=[34866]
   bw (  KiB/s): min= 4896, max= 7185, per=3.33%, avg=6144.14, stdev=271.08, samples=5974
   iops        : min=  306, max=  449, avg=384.00, stdev=16.94, samples=5974
  write: IOPS=4940, BW=77.2MiB/s (80.9MB/s)(7720MiB/100002msec)
    clat (usec): min=121, max=36225, avg=1483.90, stdev=444.83
     lat (usec): min=122, max=36226, avg=1484.70, stdev=444.83
    clat percentiles (usec):
     |  1.00th=[  660],  5.00th=[  922], 10.00th=[ 1045], 20.00th=[ 1188],
     | 30.00th=[ 1287], 40.00th=[ 1385], 50.00th=[ 1467], 60.00th=[ 1549],
     | 70.00th=[ 1647], 80.00th=[ 1762], 90.00th=[ 1942], 95.00th=[ 2114],
     | 99.00th=[ 2442], 99.50th=[ 2606], 99.90th=[ 3785], 99.95th=[ 4686],
     | 99.99th=[ 6783]
   bw (  KiB/s): min= 1728, max= 3712, per=3.33%, avg=2634.44, stdev=267.55, samples=5974
   iops        : min=  108, max=  232, avg=164.61, stdev=16.73, samples=5974
  lat (usec)   : 250=0.01%, 500=0.10%, 750=0.51%, 1000=2.28%
  lat (msec)   : 2=64.68%, 4=32.21%, 10=0.18%, 20=0.01%, 50=0.01%
  lat (msec)   : 100=0.01%
  cpu          : usr=0.22%, sys=0.77%, ctx=1646323, majf=0, minf=1
  IO depths    : 1=100.0%, 2=0.0%, 4=0.0%, 8=0.0%, 16=0.0%, 32=0.0%, >=64=0.0%
     submit    : 0=0.0%, 4=100.0%, 8=0.0%, 16=0.0%, 32=0.0%, 64=0.0%, >=64=0.0%
     complete  : 0=0.0%, 4=100.0%, 8=0.0%, 16=0.0%, 32=0.0%, 64=0.0%, >=64=0.0%
     issued rwts: total=1152201,494059,0,0 short=0,0,0,0 dropped=0,0,0,0
     latency   : target=0, window=0, percentile=100.00%, depth=1

Run status group 0 (all jobs):
   READ: bw=180MiB/s (189MB/s), 180MiB/s-180MiB/s (189MB/s-189MB/s), io=17.6GiB (18.9GB), run=100002-100002msec
  WRITE: bw=77.2MiB/s (80.9MB/s), 77.2MiB/s-77.2MiB/s (80.9MB/s-80.9MB/s), io=7720MiB (8095MB), run=100002-100002msec

Disk stats (read/write):
    dm-0: ios=1150221/493189, merge=0/0, ticks=2238455/722820, in_queue=2961275, util=99.69%, aggrios=1152202/494083, aggrmerge=0/4, aggrticks=2242943/723812, aggrin_queue=2129786, aggrutil=99.69%
  vda: ios=1152202/494083, merge=0/4, ticks=2242943/723812, in_queue=2129786, util=99.69%
[root@DT_Node-172_30_19_231 /data]#